Eleven Oaks Realty is proud to present their January 2015 Austin Real Estate Price Report measuring activity in the Austin single family home market.
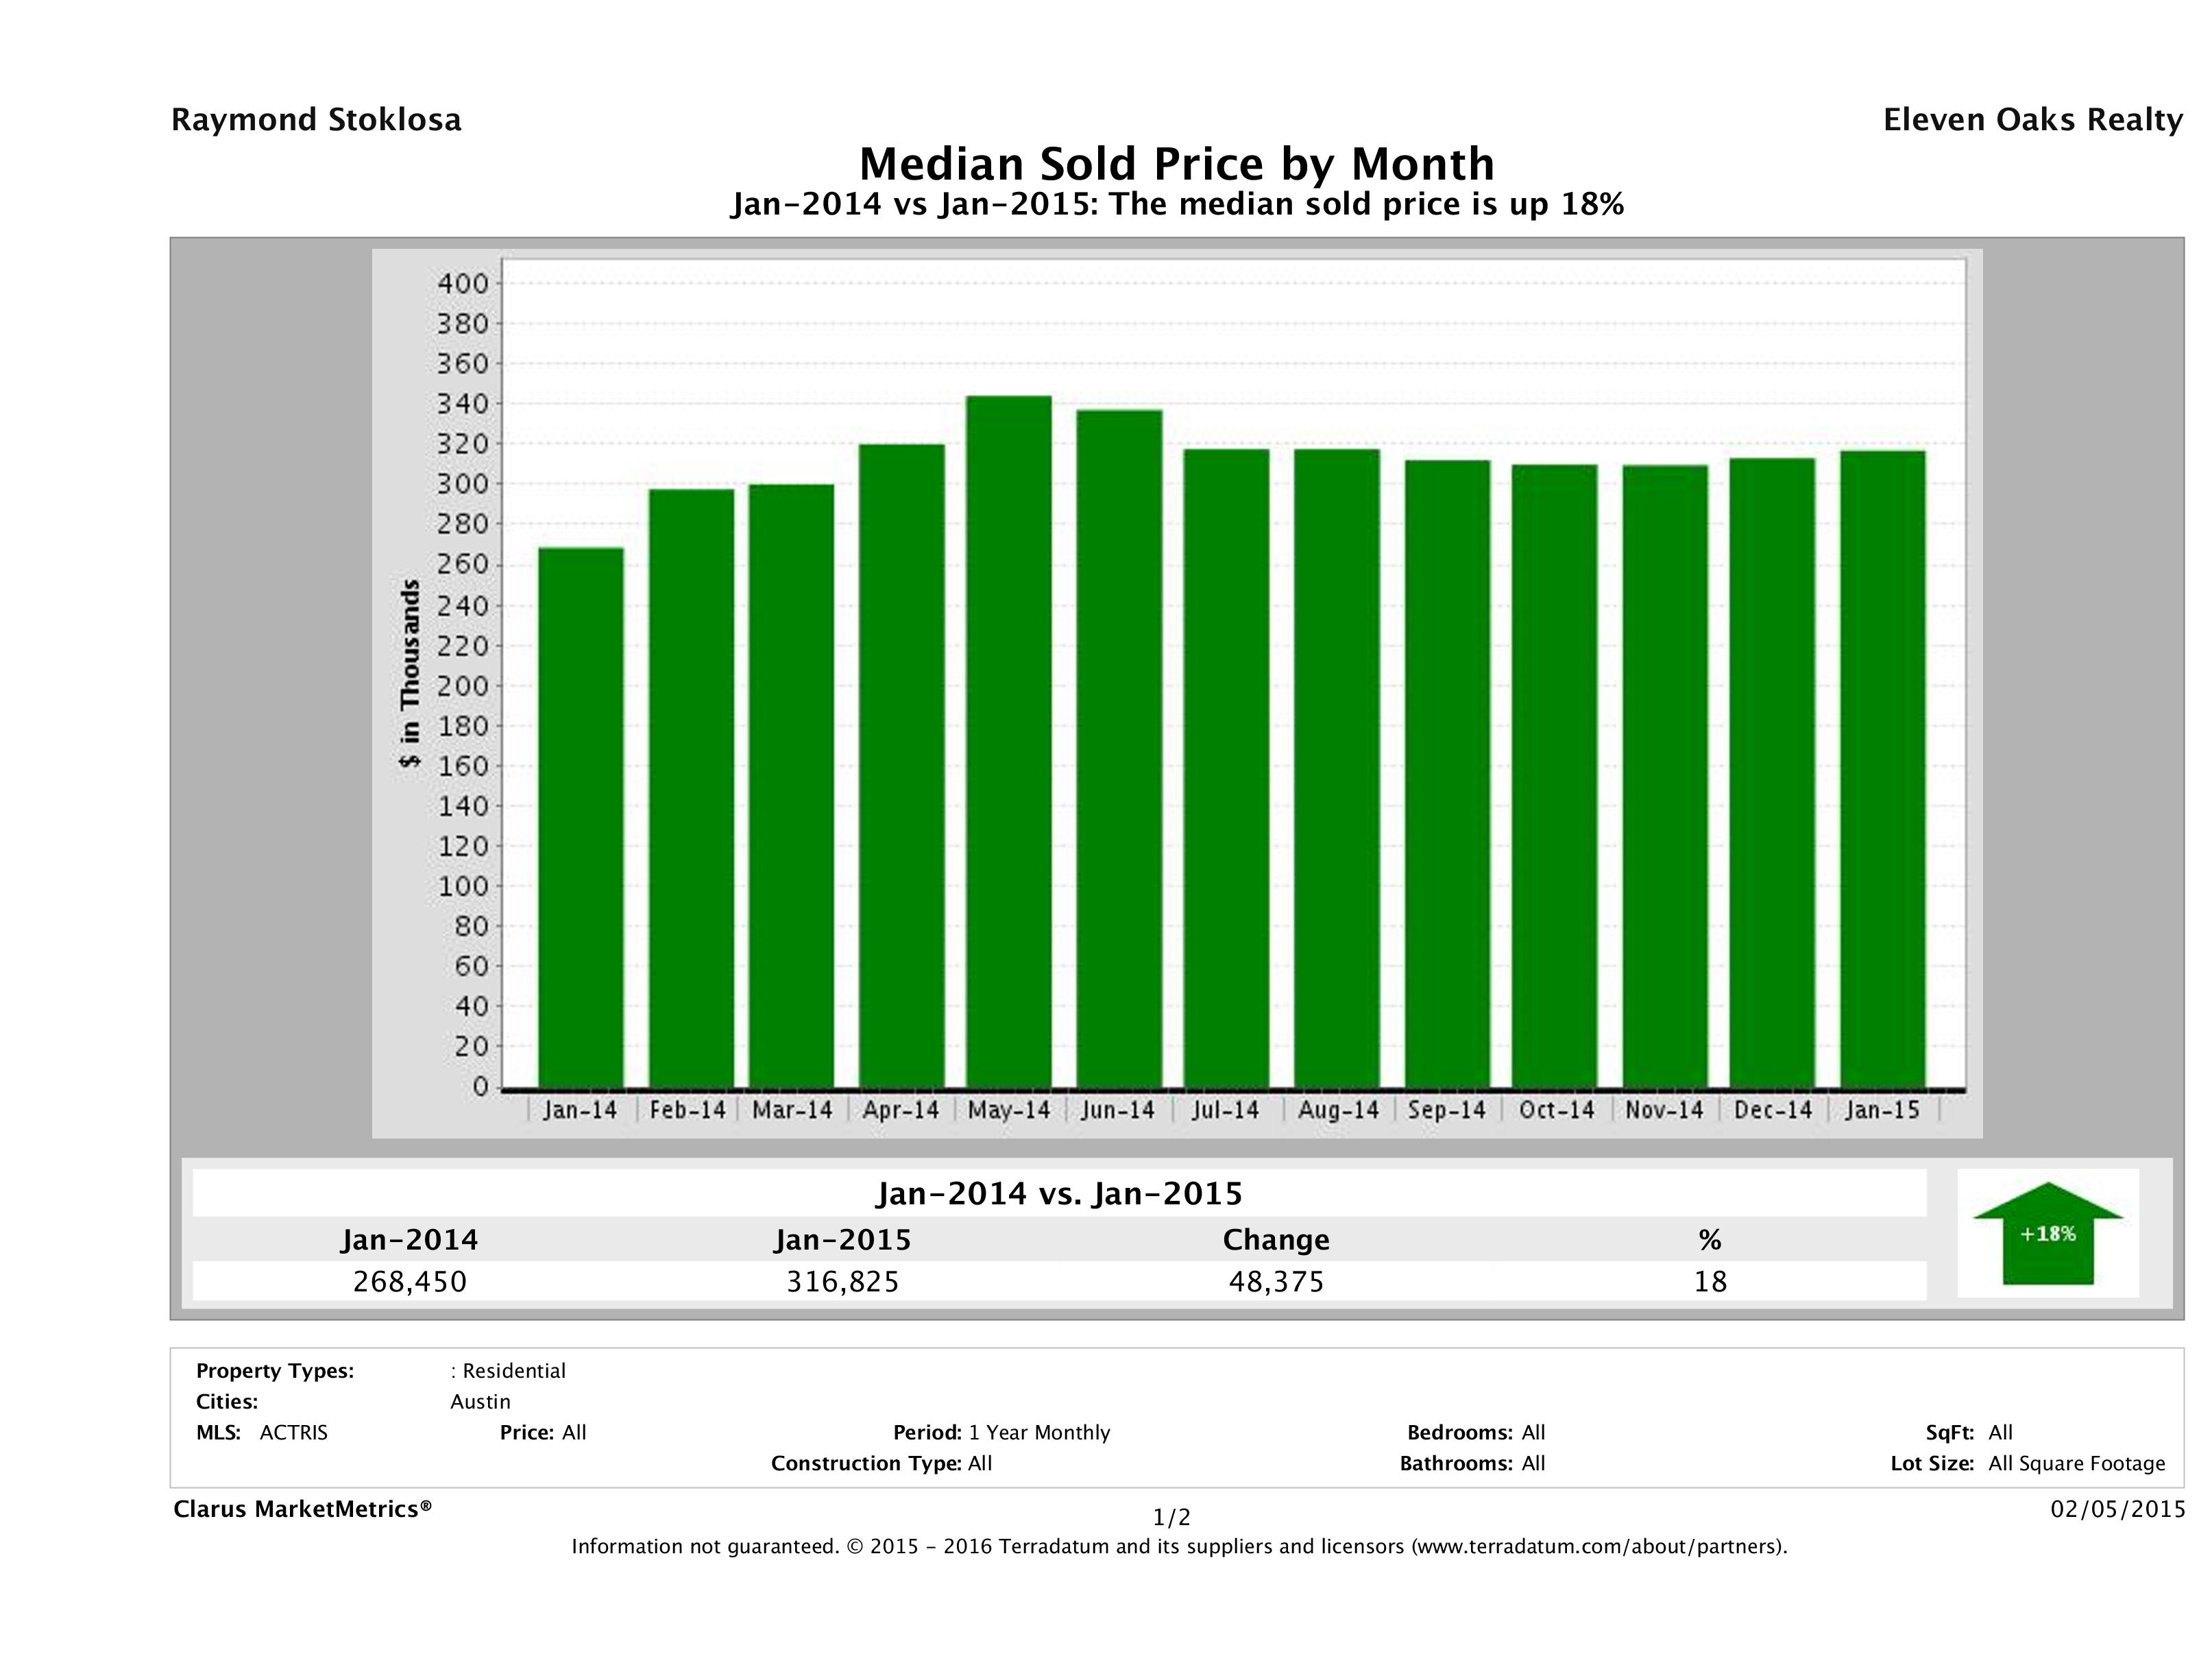
Austin Median Home Price Up 18%
For the fifth month in a row, the biggest story in this month’s Austin Real Estate Price Report comes by way of median home price. The median home price of an Austin home in January 2014 was $268,450 compared to $316,825 in January 2015, marking an 18% increase in year over year numbers. Even though we have more supply and less demand this month, buyers are still willing to pay more for a home than they were at this time last year and by quite a bit.
Median home price helps us see the distribution of homes sold and does not really give us an indication of the increase or decrease in a particular home’s market value. To analyze market value, we’d have to take an in depth look at a neighborhood. If you’re looking for something like that, please check out our Austin Home Values Report.
What does this mean to buyers? Though prices have increased since last year at this time, they are still below the Spring peak we saw in May 2014. Buy early in Spring and avoid paying more than you have to. You’ll see later in the report, demand is down and supply is up, which will give buyers who buy before the demand picks up more choices.
What does this mean to sellers? Get your homes ready to sell now. The busy Spring home buying season is just around the corner and if this year is anything like last year (and it’s leaning that way), sellers will get more for their homes than at any other time of year. Preparing your home to sell for top dollar usually takes a month or two, so now is the perfect time to start.
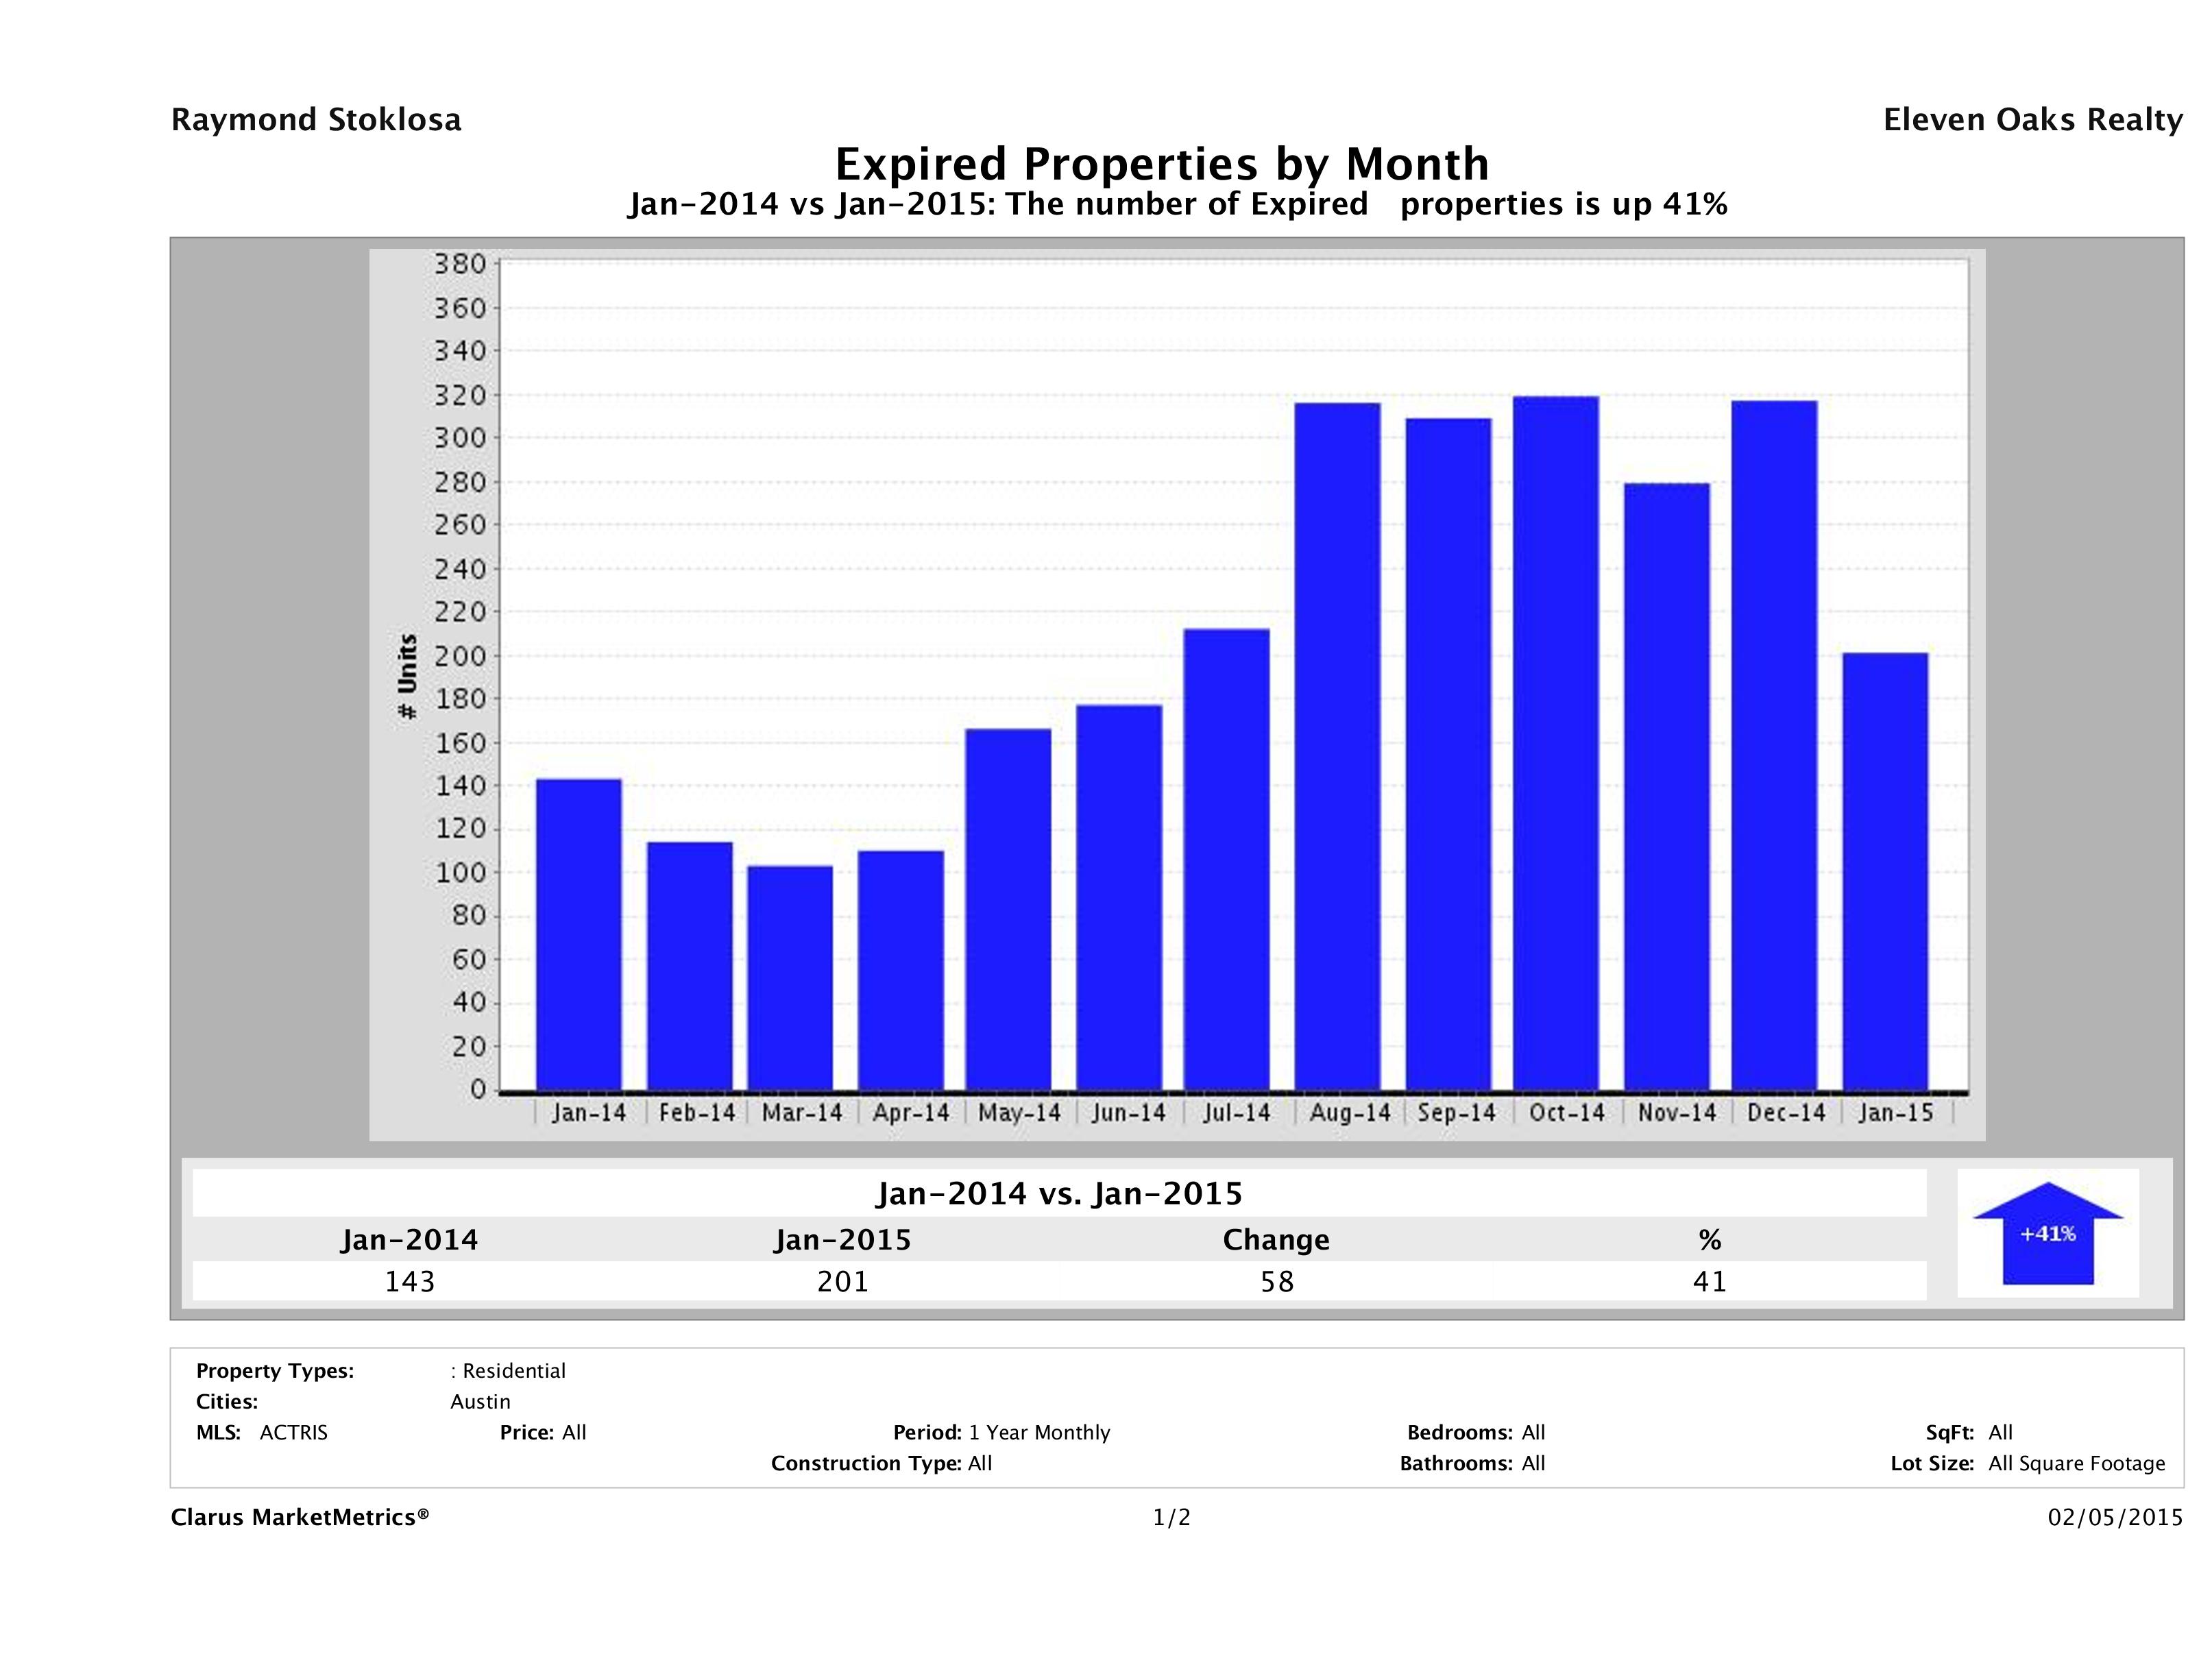
Number of Homes Taken Off the Market Up 41%
For the sixth straight month, we saw a significant increase in the number of homes taken off the market in Austin. In January 2014, there were 143 single family homes taken off the market compared to 201 in January 2015, marking a 41% (58 home) increase city wide. If we did some further analysis, we would likely find many of these homes were overpriced and instead of lowering their price, sellers decided to take them off the market and try again when the market picks up in Spring. If you don’t have to sell and you’re just testing the market, Spring is the best time to do so. If you need to sell and your home was priced right, maybe there was something else going on. The biggest culprits we see are incorrect info in the MLS and poor marketing. Check out our Austin Home Marketing Plan to see how your homes would be marketed.
Having trouble selling your home? Check out our Austin Home Not Selling resources page to find out why.
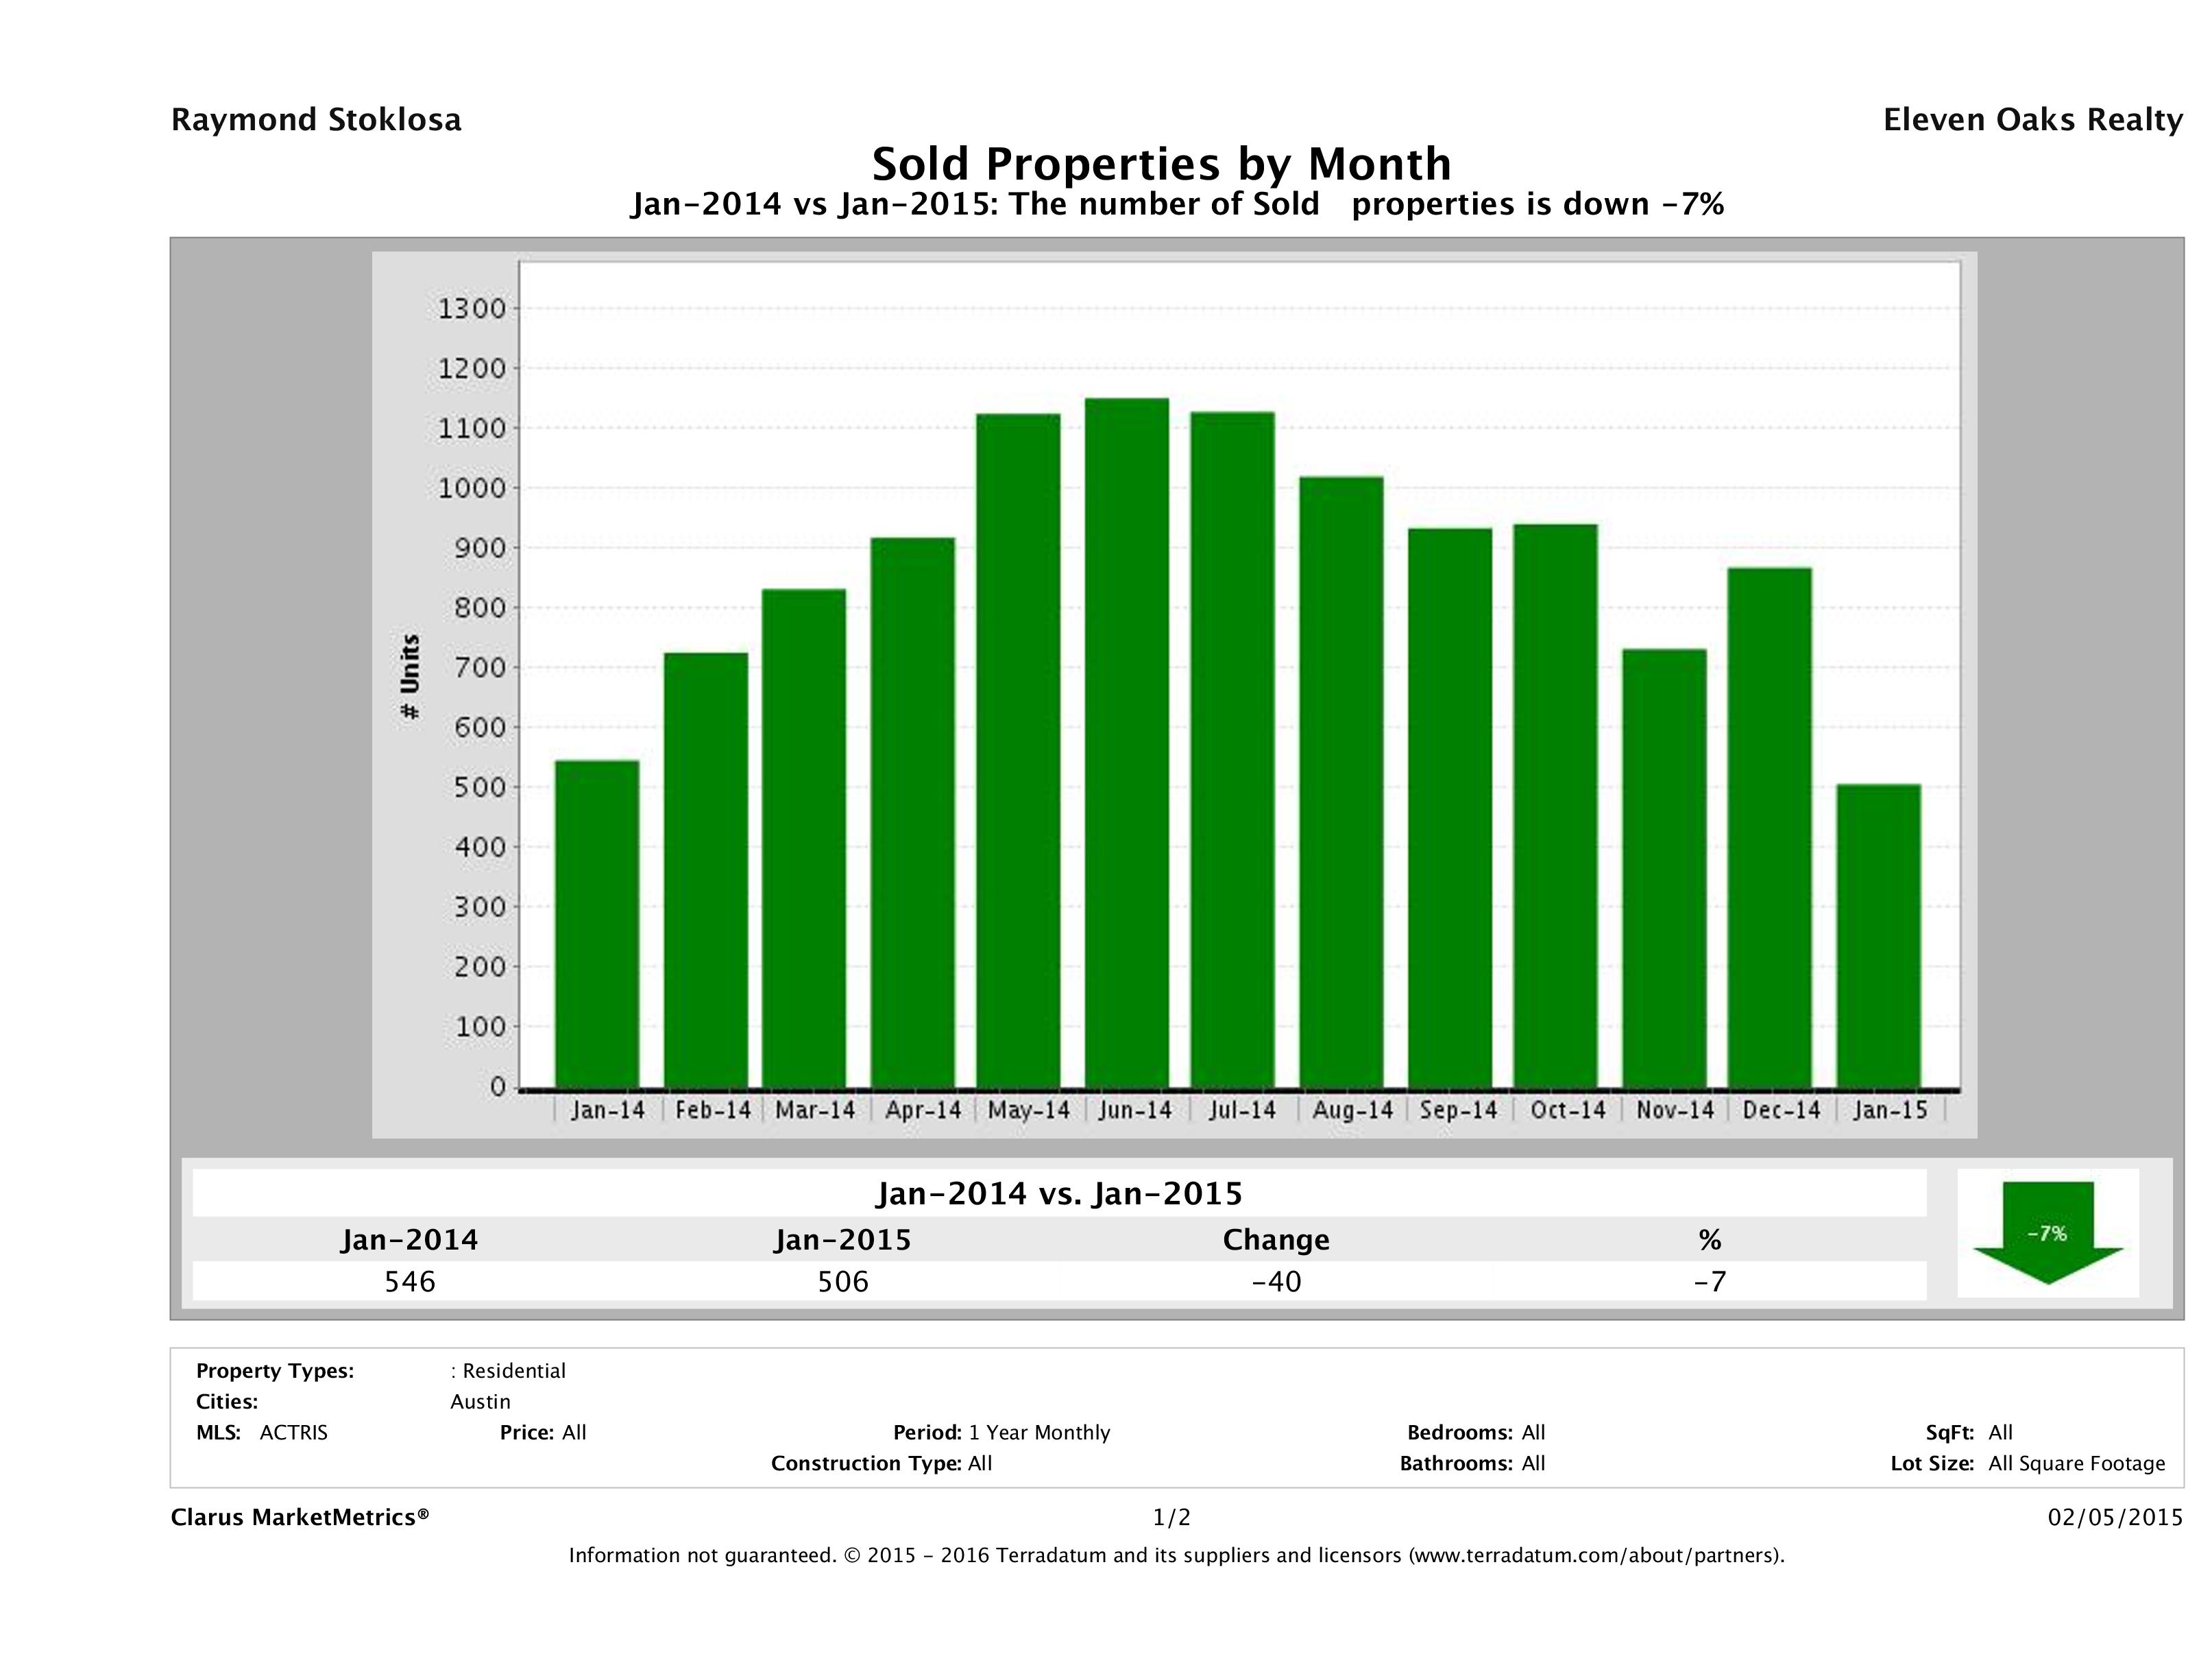
Number of Sold Homes in Austin Down 7%
This month, the number of homes sold in Austin were at the lowest point since January 2014, which is to be expected from seasonal trends. Traditionally, January is the slowest month for closings as January closings usually go under contract in December, when very few buyers are actively engaged in the home buying process. In January 2015, Austin saw a 7% decrease in the number of homes sold from January 2014 to January 2015. In January 2015, we saw 506 homes sell in Austin compared to 546 in January 2014 marking a 7% (40 home) decrease in year over year numbers.
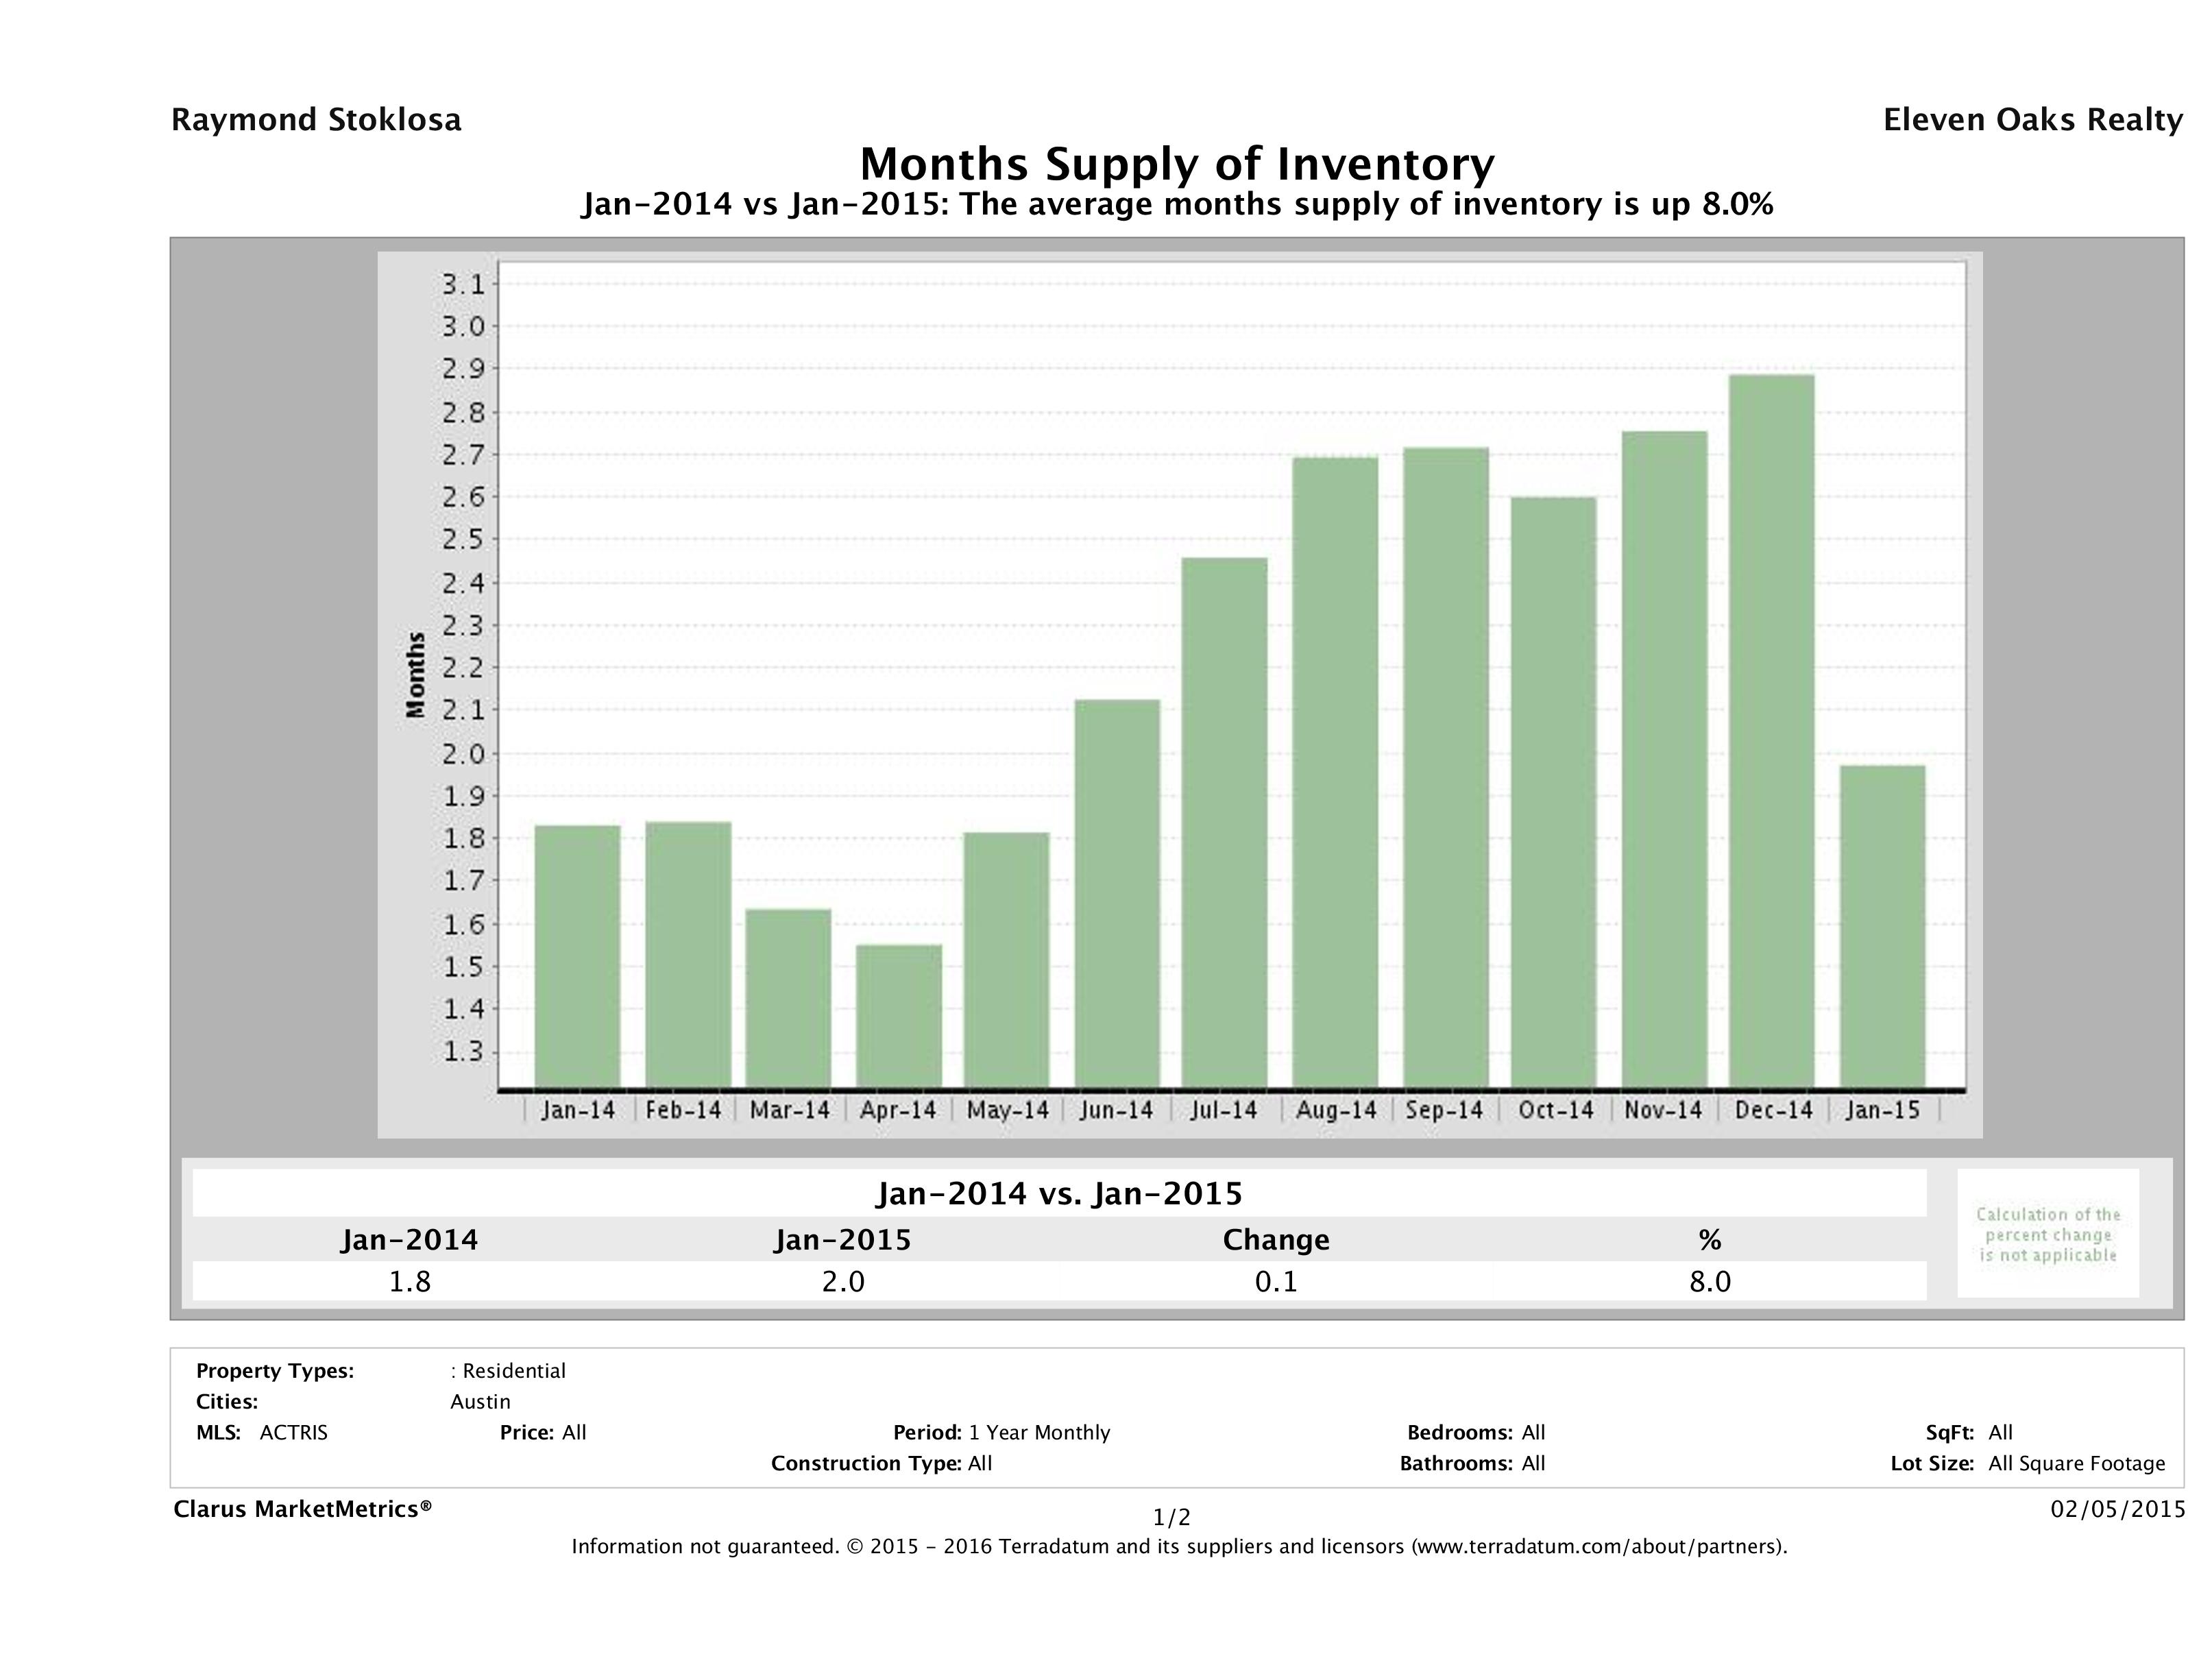
Austin Housing Inventory Up 8%
In January 2015, we saw 2.0 months of inventory on the market, compared to 1.8 months of inventory in January 2014, marking an 8% increase in year over year numbers. The drop in inventory from December to January is a predictable seasonal trend we see yearly.
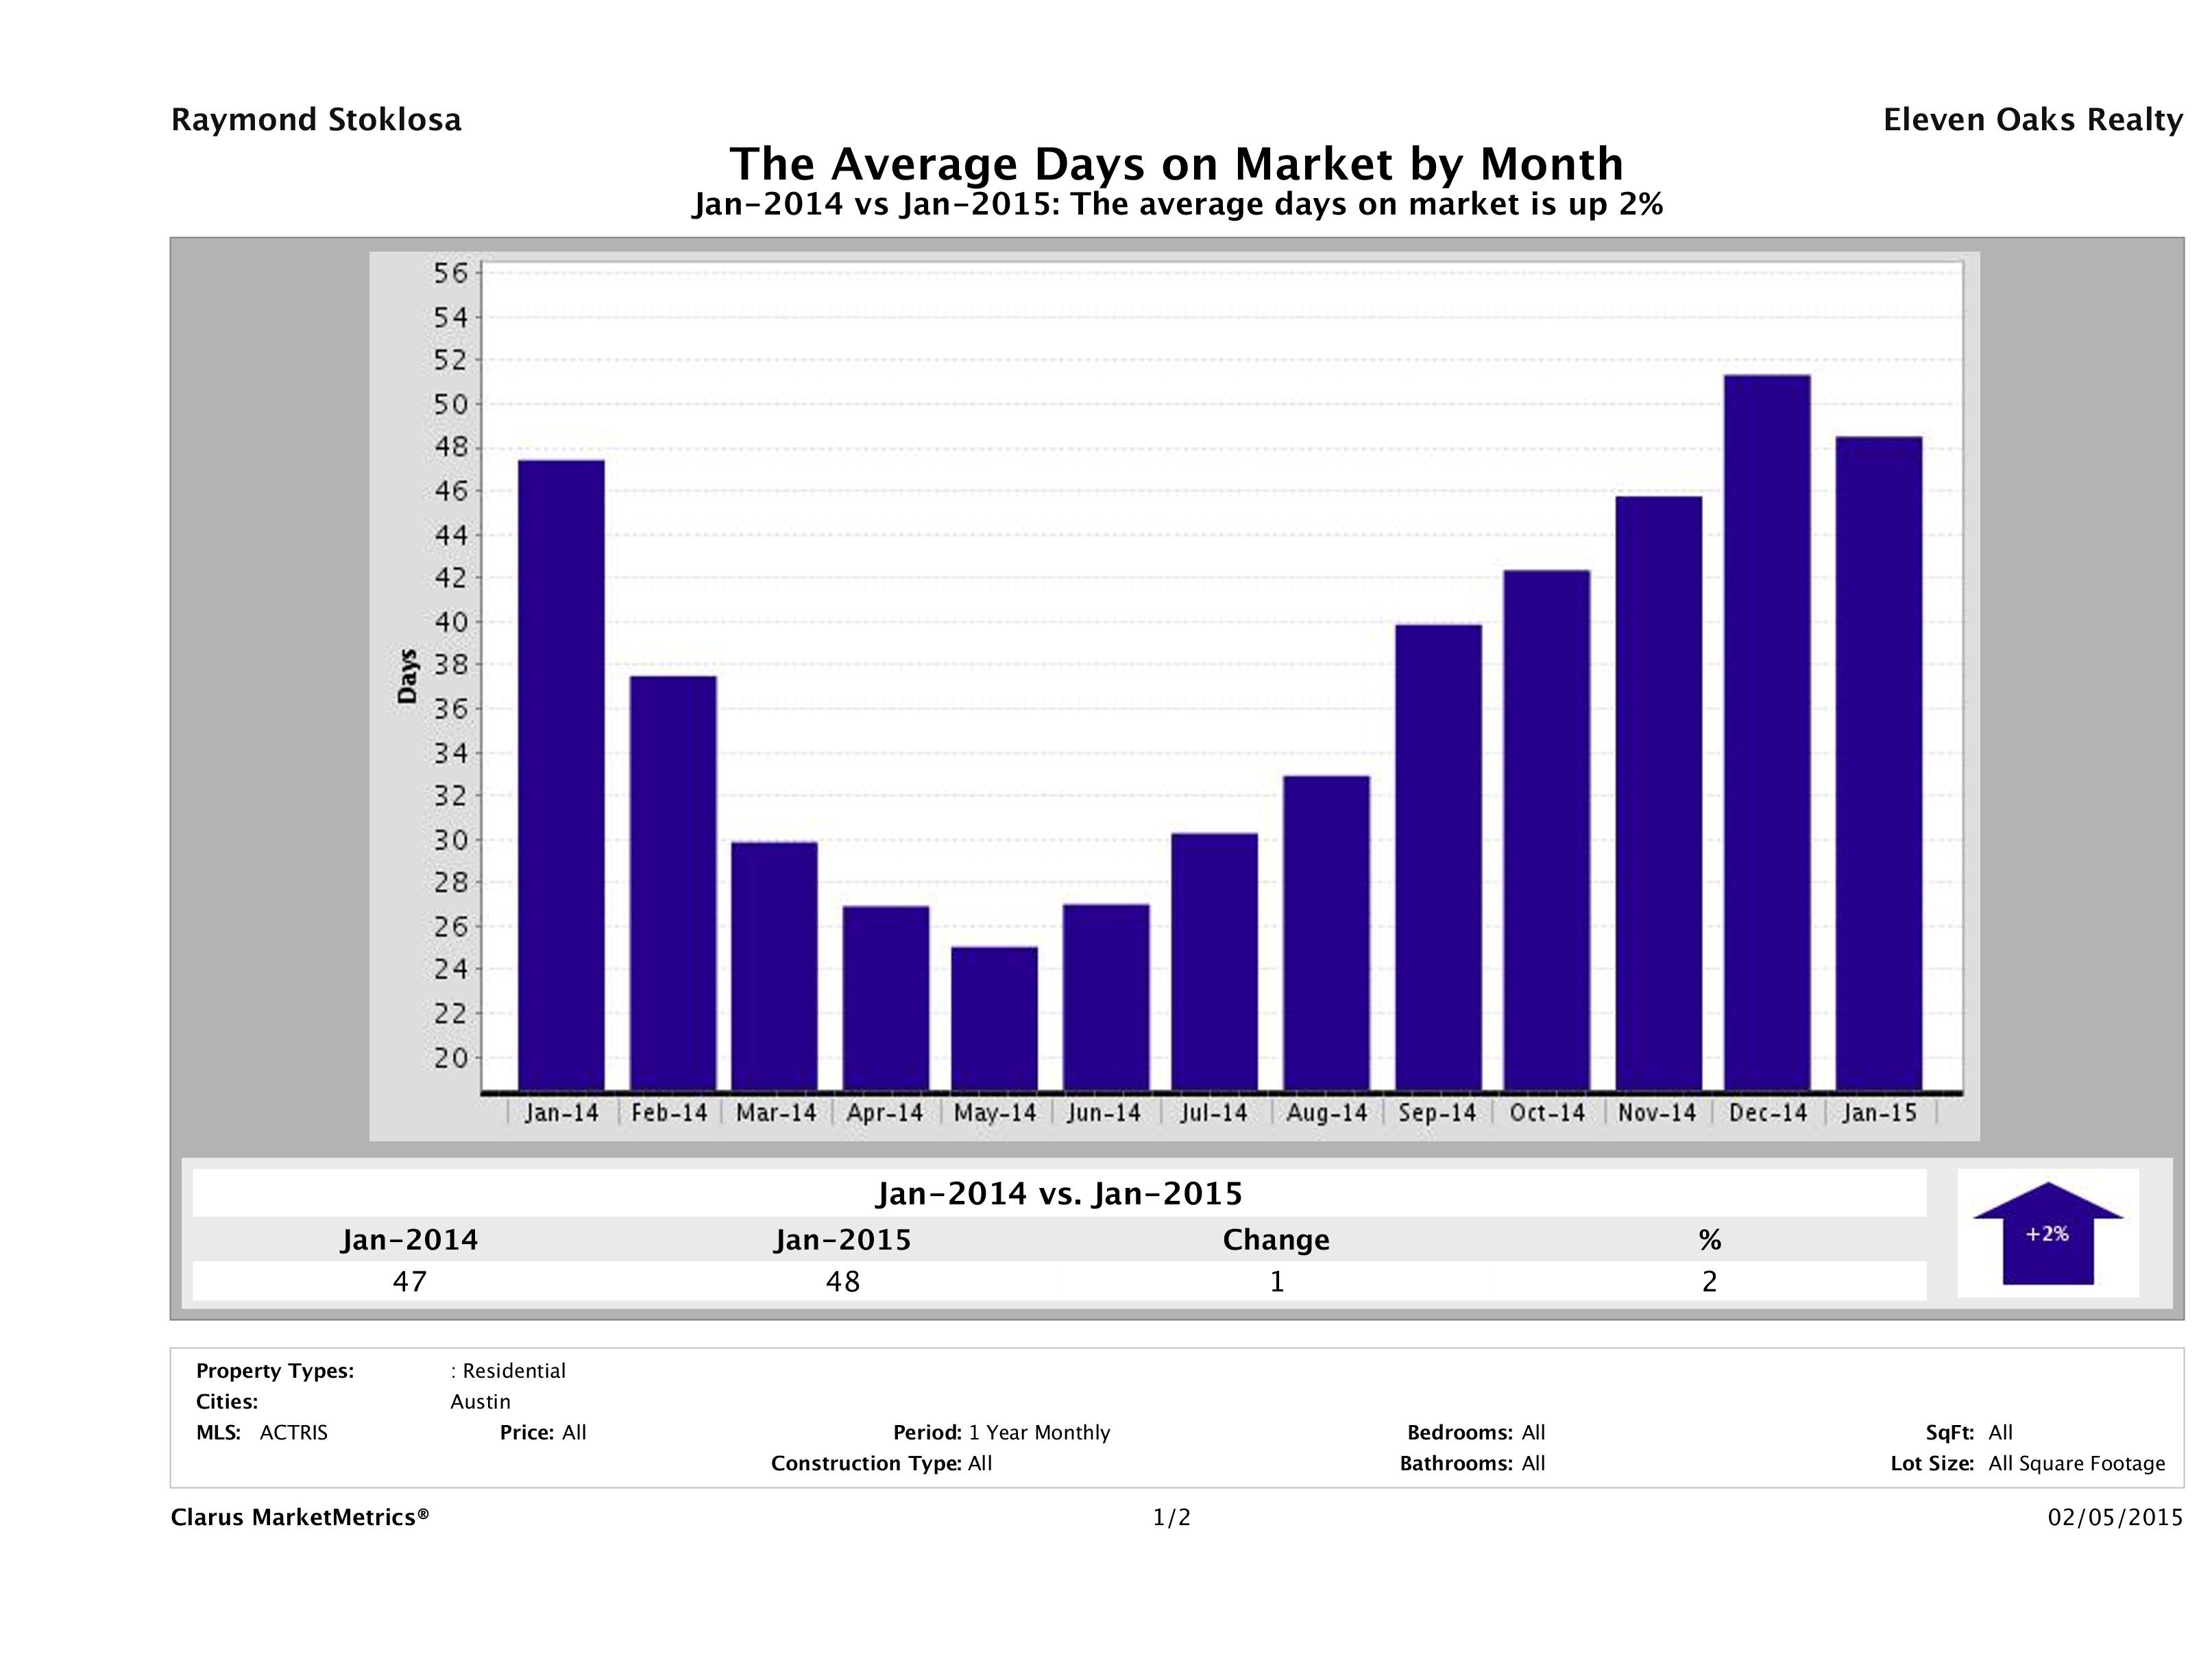
Time to Sell Home in Austin Up 2%
In January 2015, it took 48 days to sell a home in Austin, on average, compared to 47 days in January 2014, marking a 2% (1 day) increase in year over year numbers. Though not statistically significant, this does confirm the general trend in the decreased time to sell we usually see after the first of the year. We would expect time to sell to decrease as we get deeper into Spring. For those who experienced the busy Spring and Summer markets, 47 days may seem like a long time. But remember, this figure is a city-wide average. Time to sell in your neighborhood is likely less, especially if you’re in a good school district.
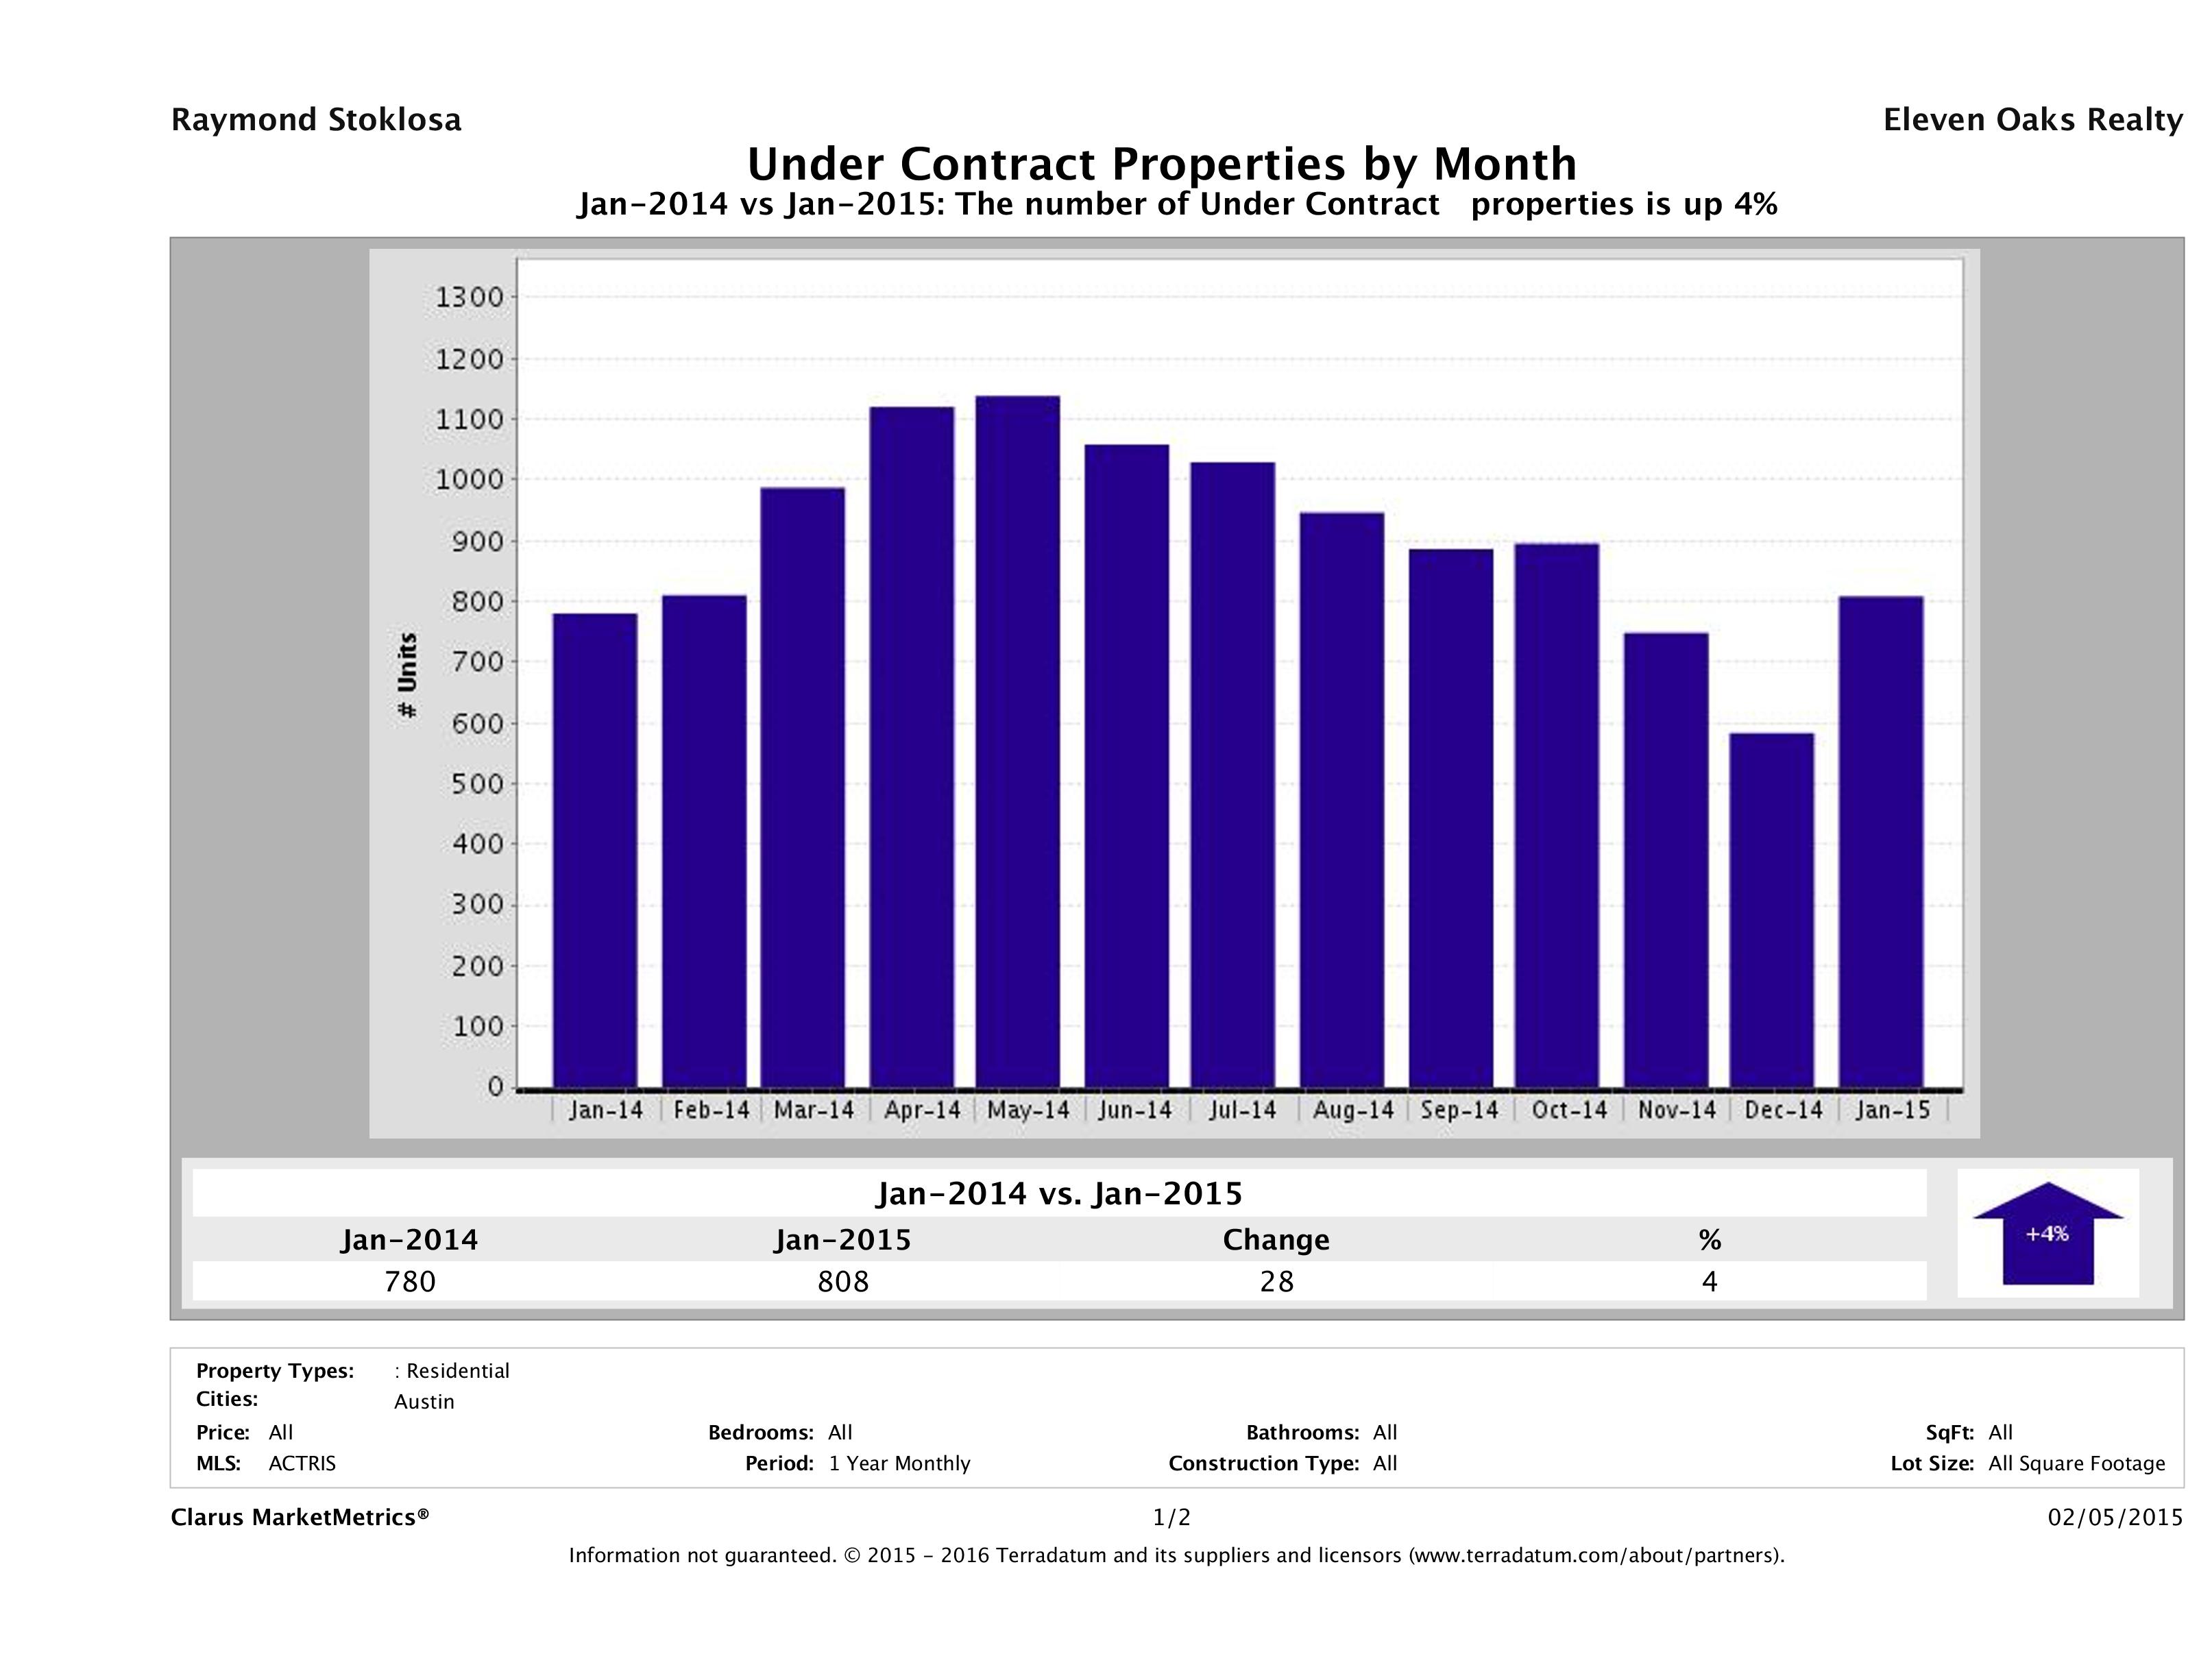
Austin Homes Under Contract Up 4%
In January 2015, 808 homes went pending (under contract) in Austin compared to 780 in January 2014, marking a 4% increase in year over year numbers.
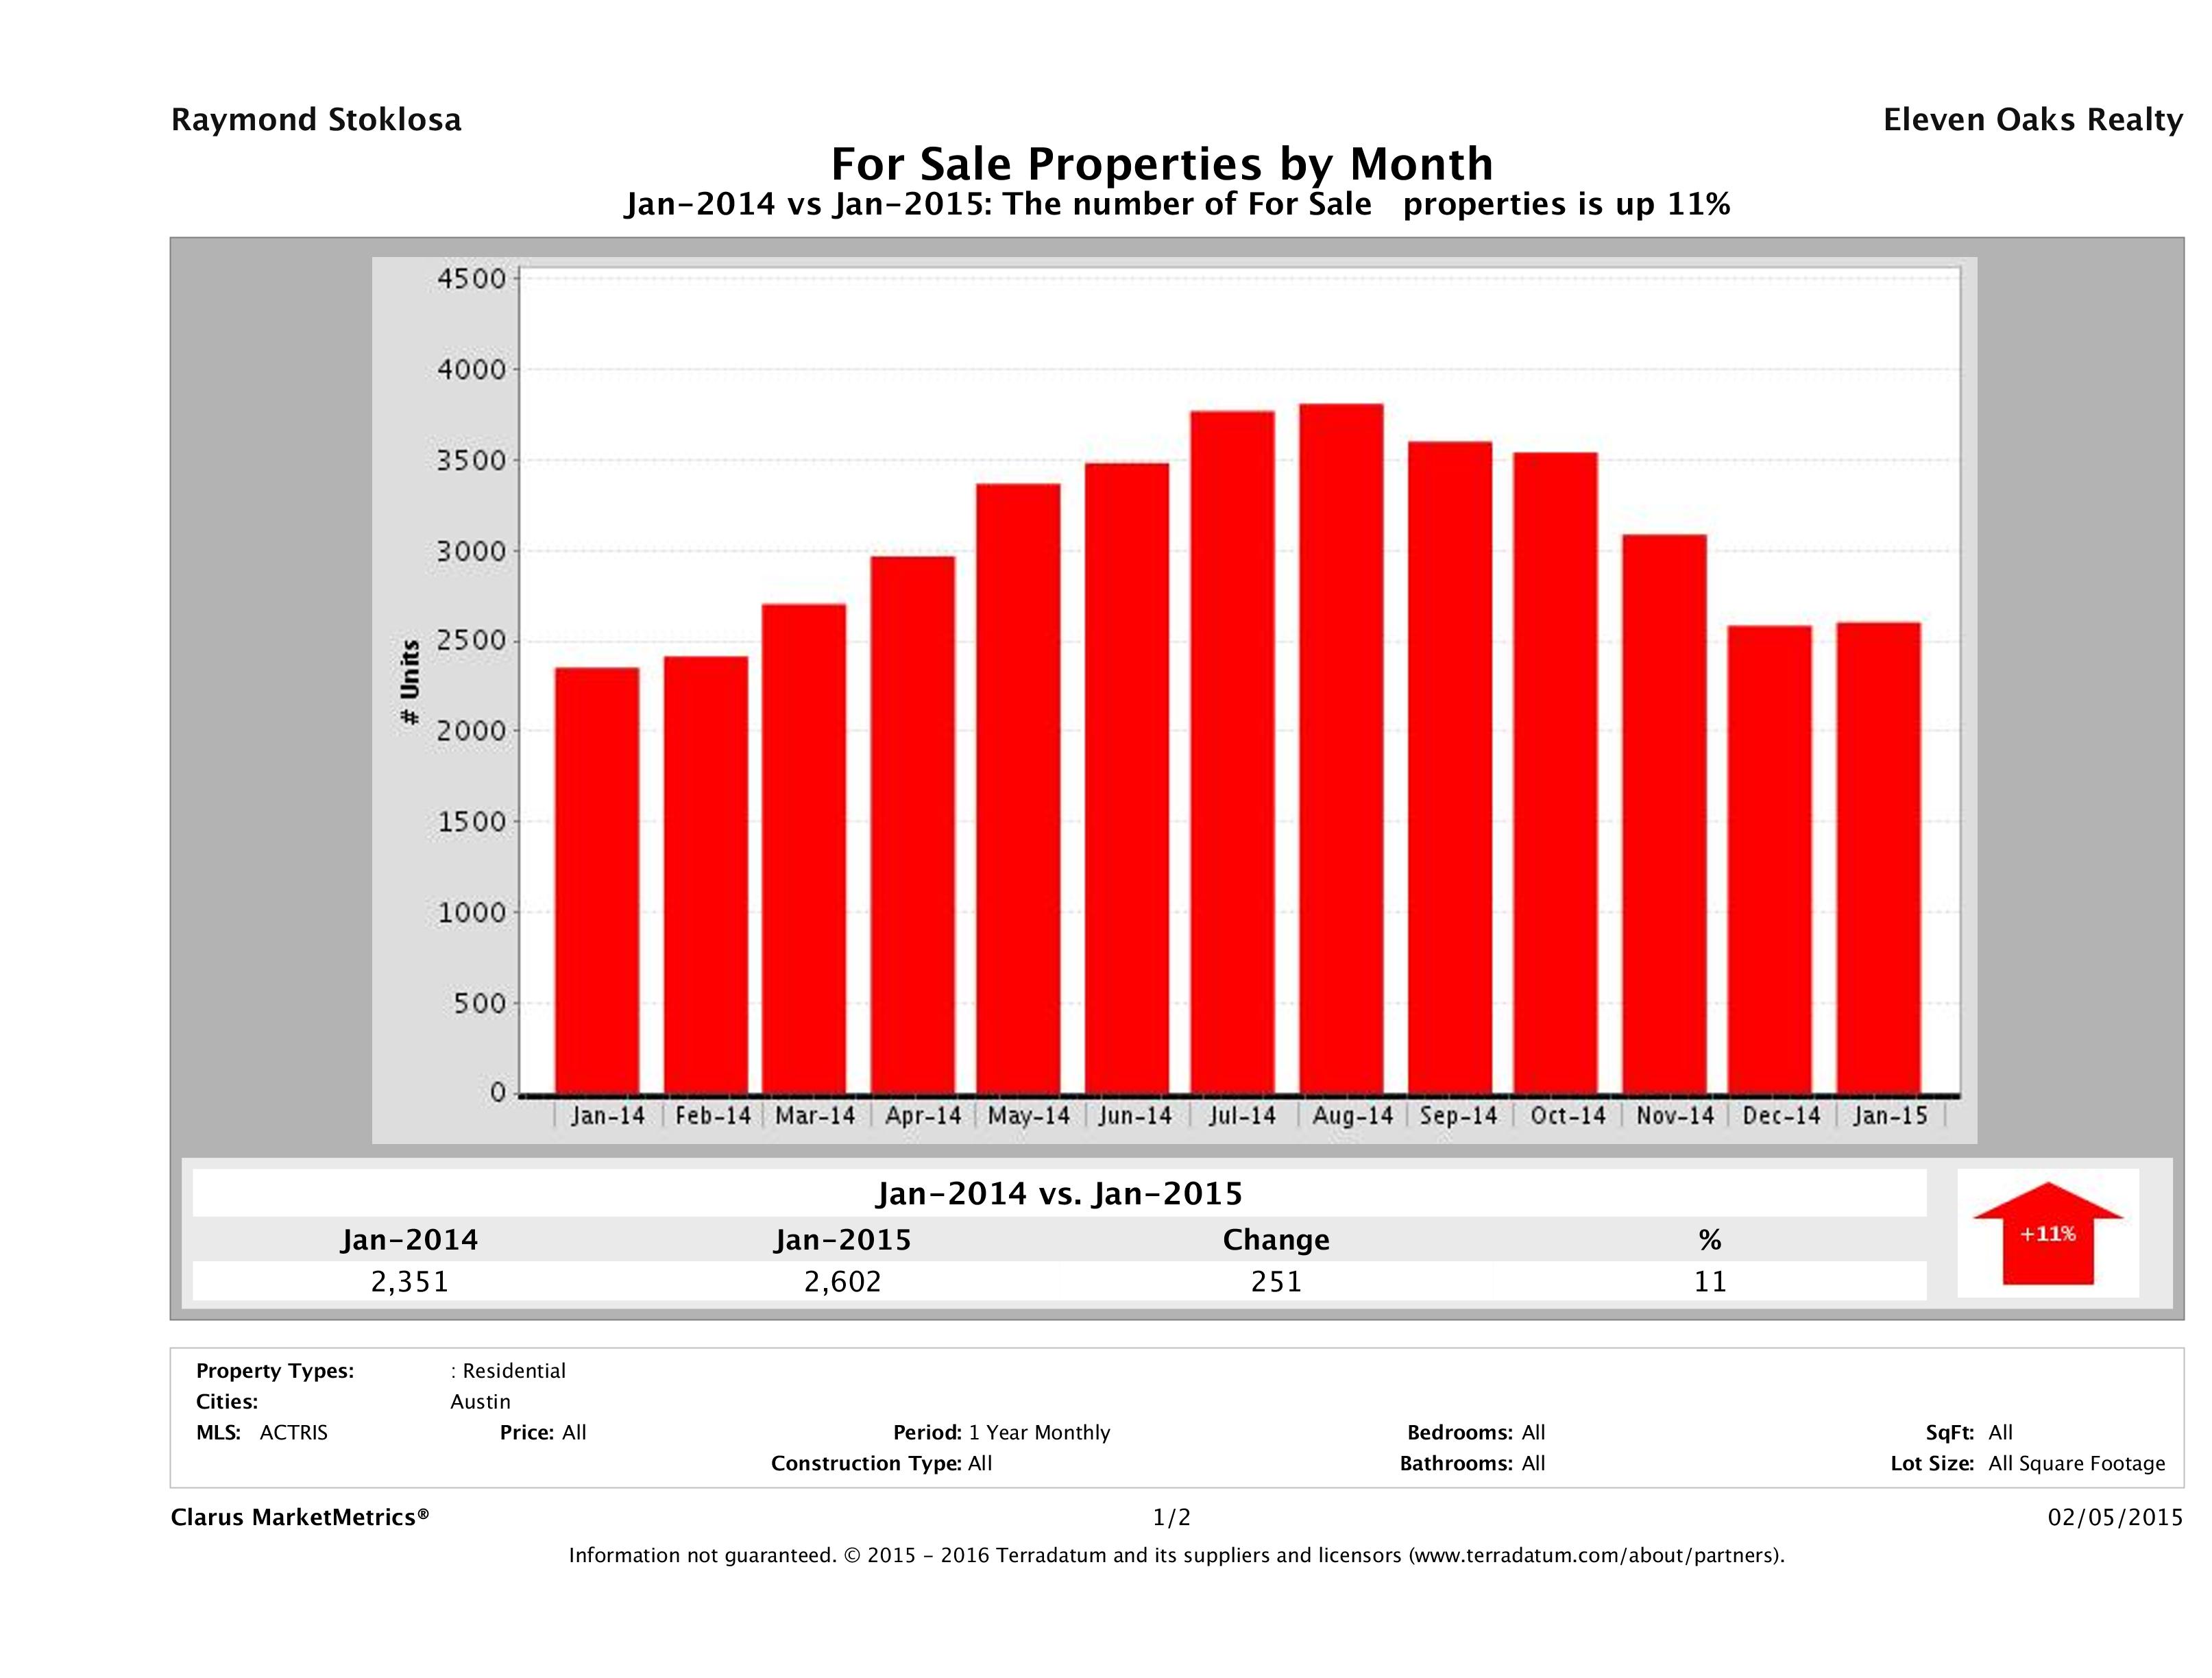
Number of Homes on the Market Up 11%
In January 2015, we had 2,602 homes for sale in Austin, compared to 2,351 in January 2014, showing an 11% (251 home) increase in year over year numbers. More sellers seem confident in the direction of the market and are looking to take advantage of the qualified buyers willing to pay more than they were last year.
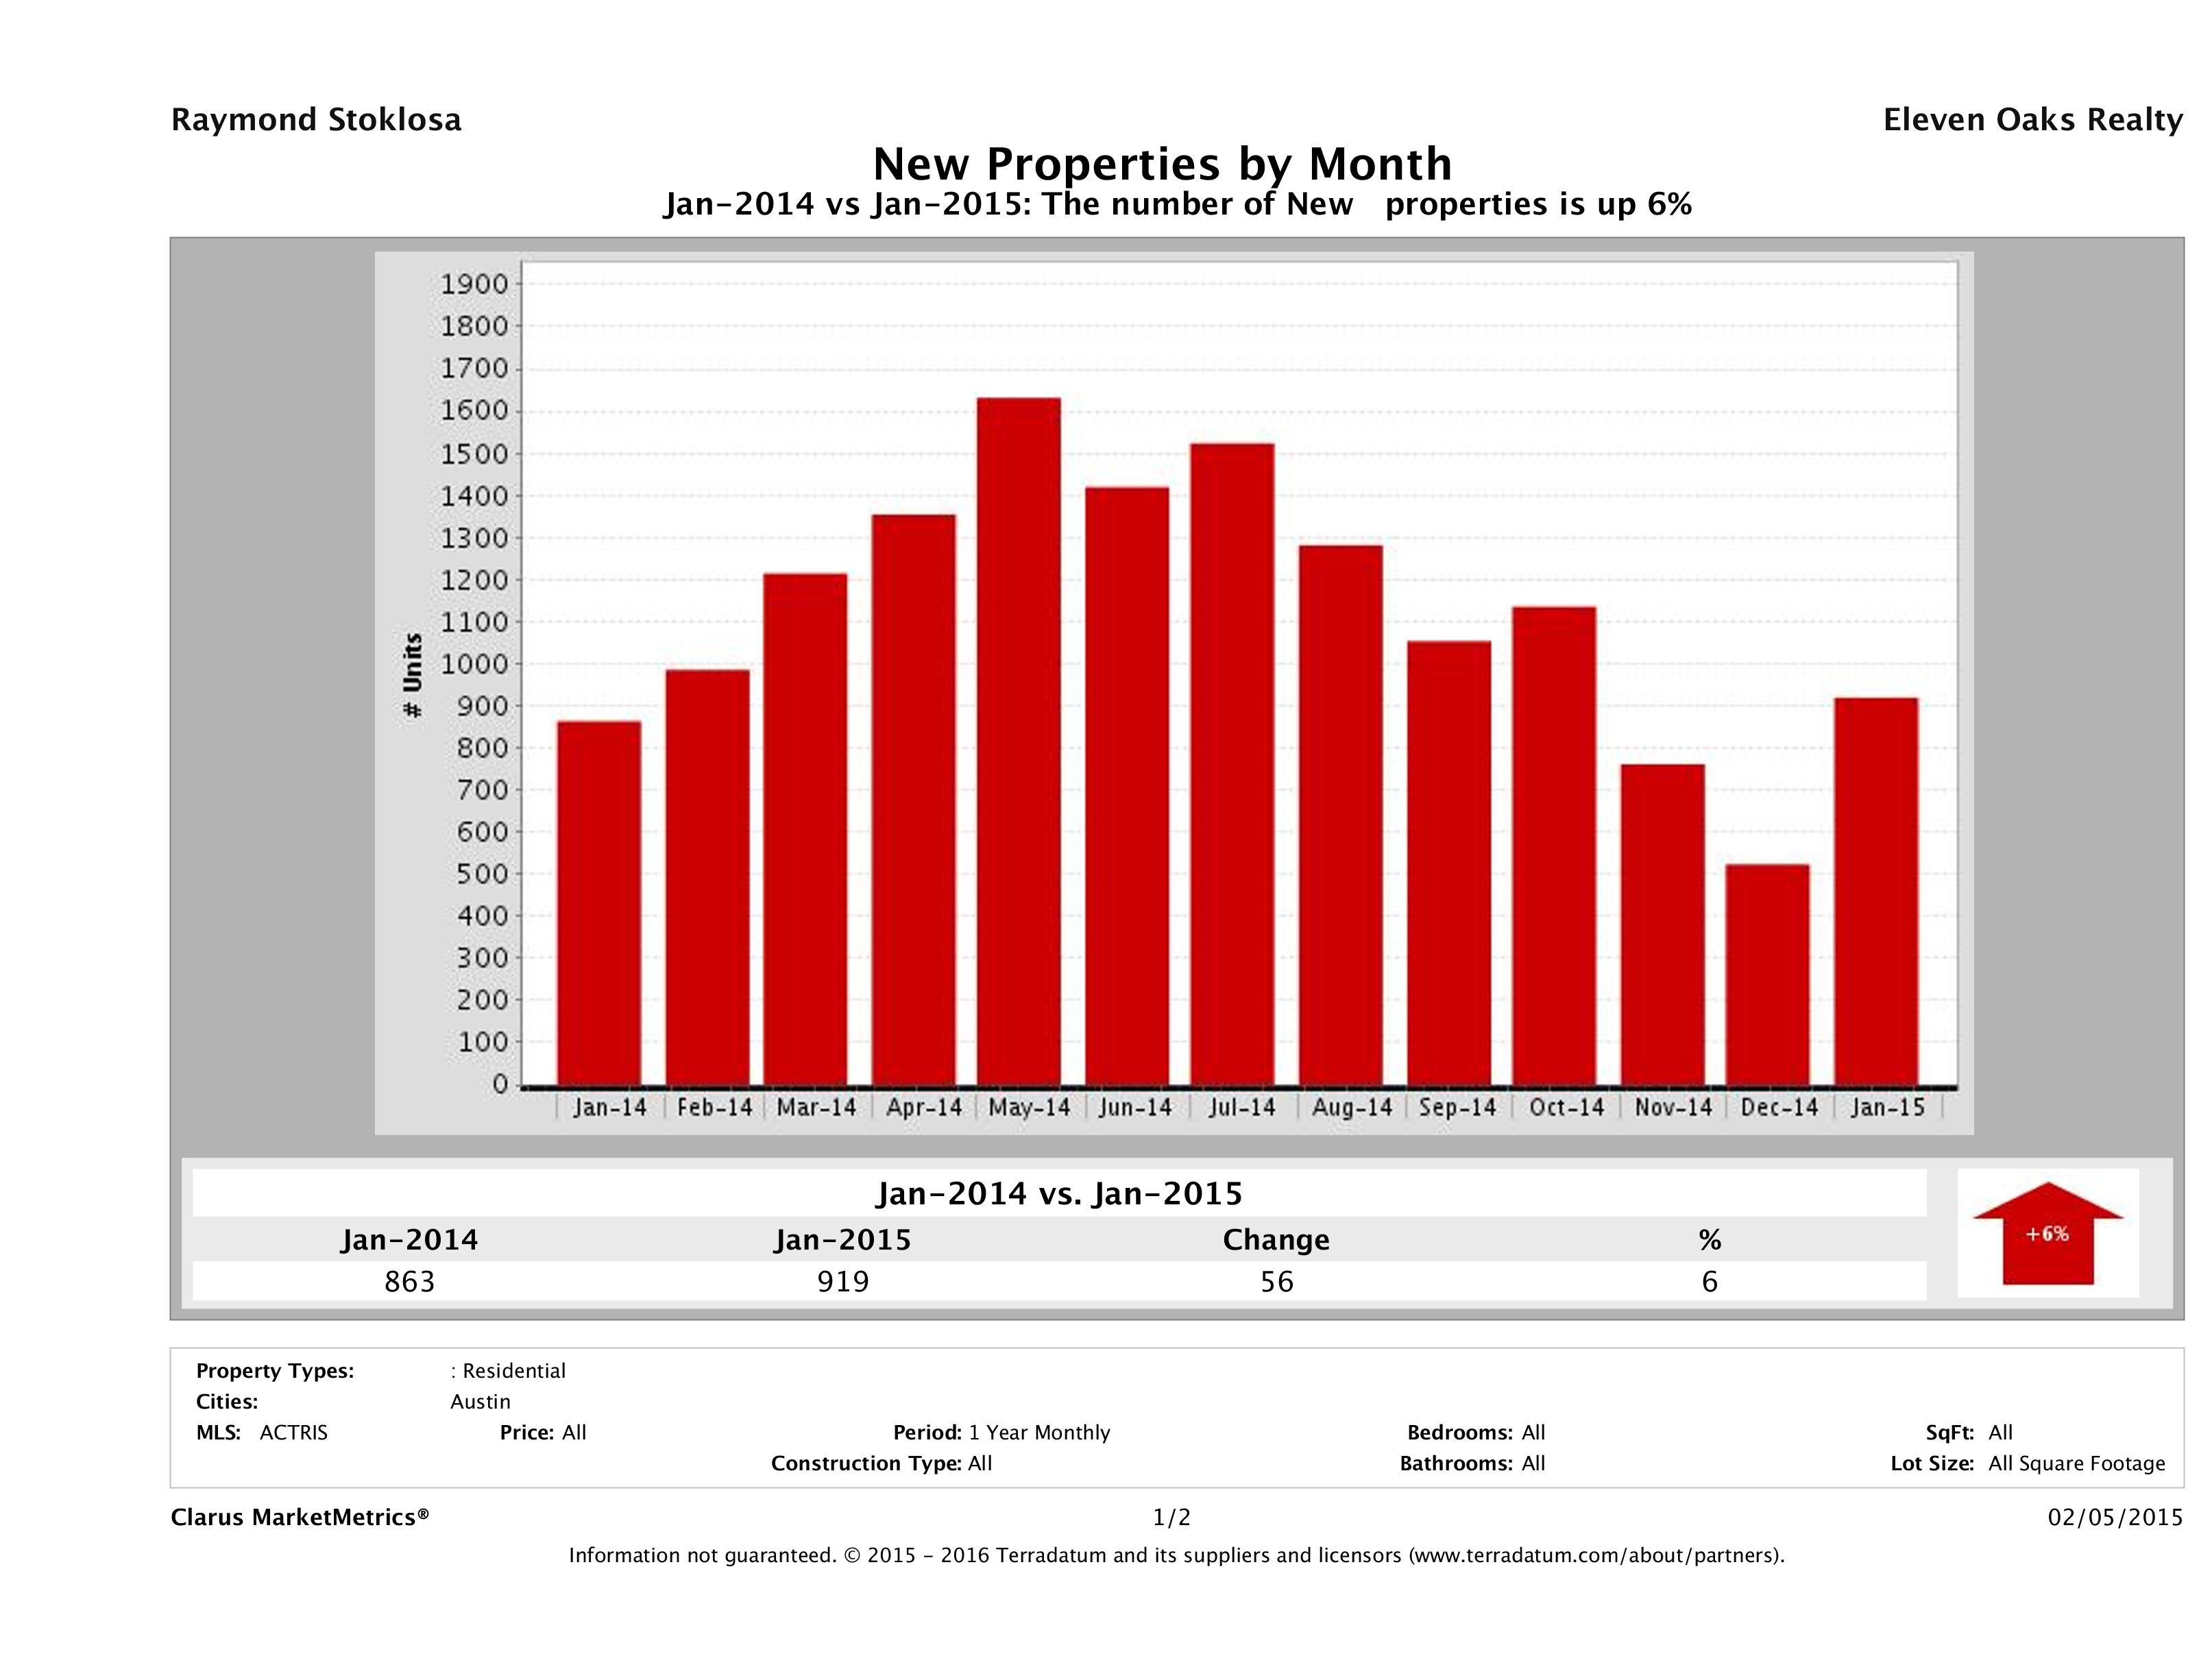
Number of Homes Listed for Sale Up 6%
In January 2015, we saw 919 homes introduced to the market compared to 863 in January 2014, marking a 6% (56 home) increase. This year seems to be starting off a bit stronger than last year.
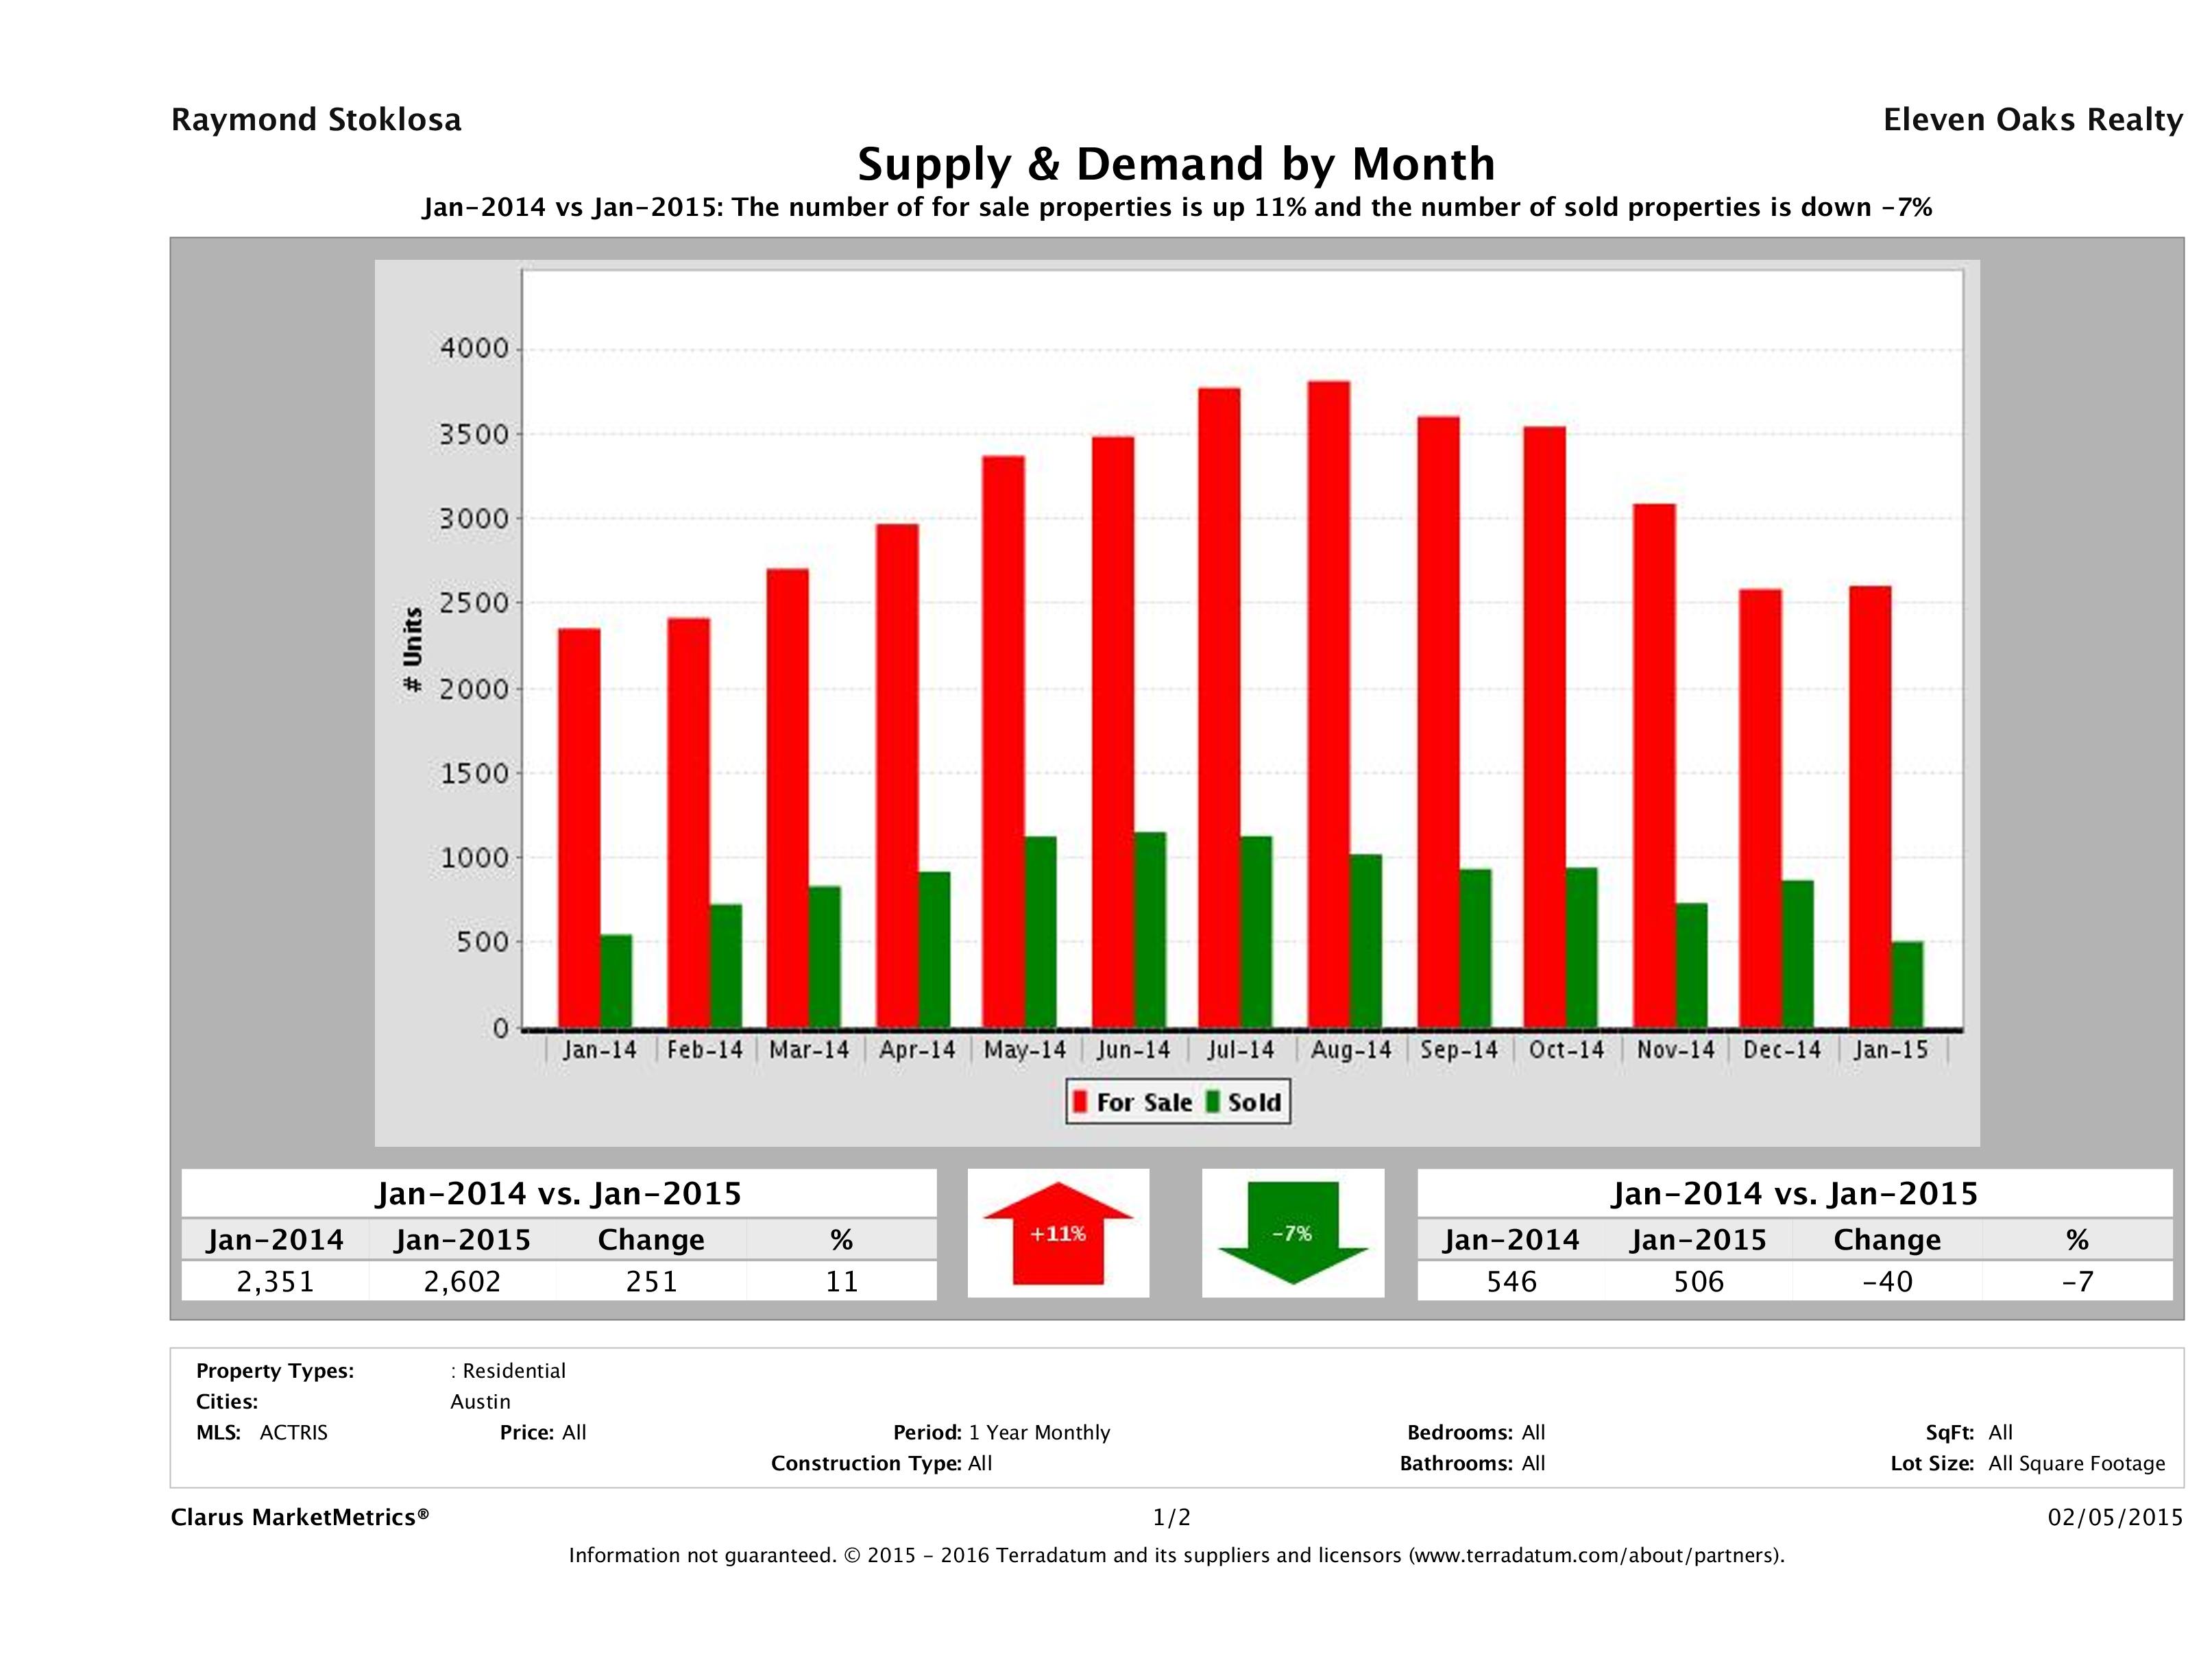
Supply Up 11% and Demand is Down 7%
This month we saw an 11% increase in supply (number of properties for sale) and a 7% decrease in demand (number of sold properties). The increase in supply and decrease in demand is a trend we’ve seen for a few months now. If you’re a buyer, take advantage of more choices. As we head into Spring and demand picks up, supply will also decrease, which will probably create another frenzy to buy. If you can find something now, you’ll avoid the inevitable price increases that come from multiple offers and overbids.
Median for Sale Up 11% vs Median Sold Price Up 18%
This chart compares the Median for Sale Price vs the Median Sold Price to show their relationship. In Austin, we saw an 11% increase in the median for sale price and an 18% increase in the median sold price of a single family home in year over year numbers. Though sellers are pricing their homes higher than last year, buyers are still willing to pay more, which should be great news for sellers.
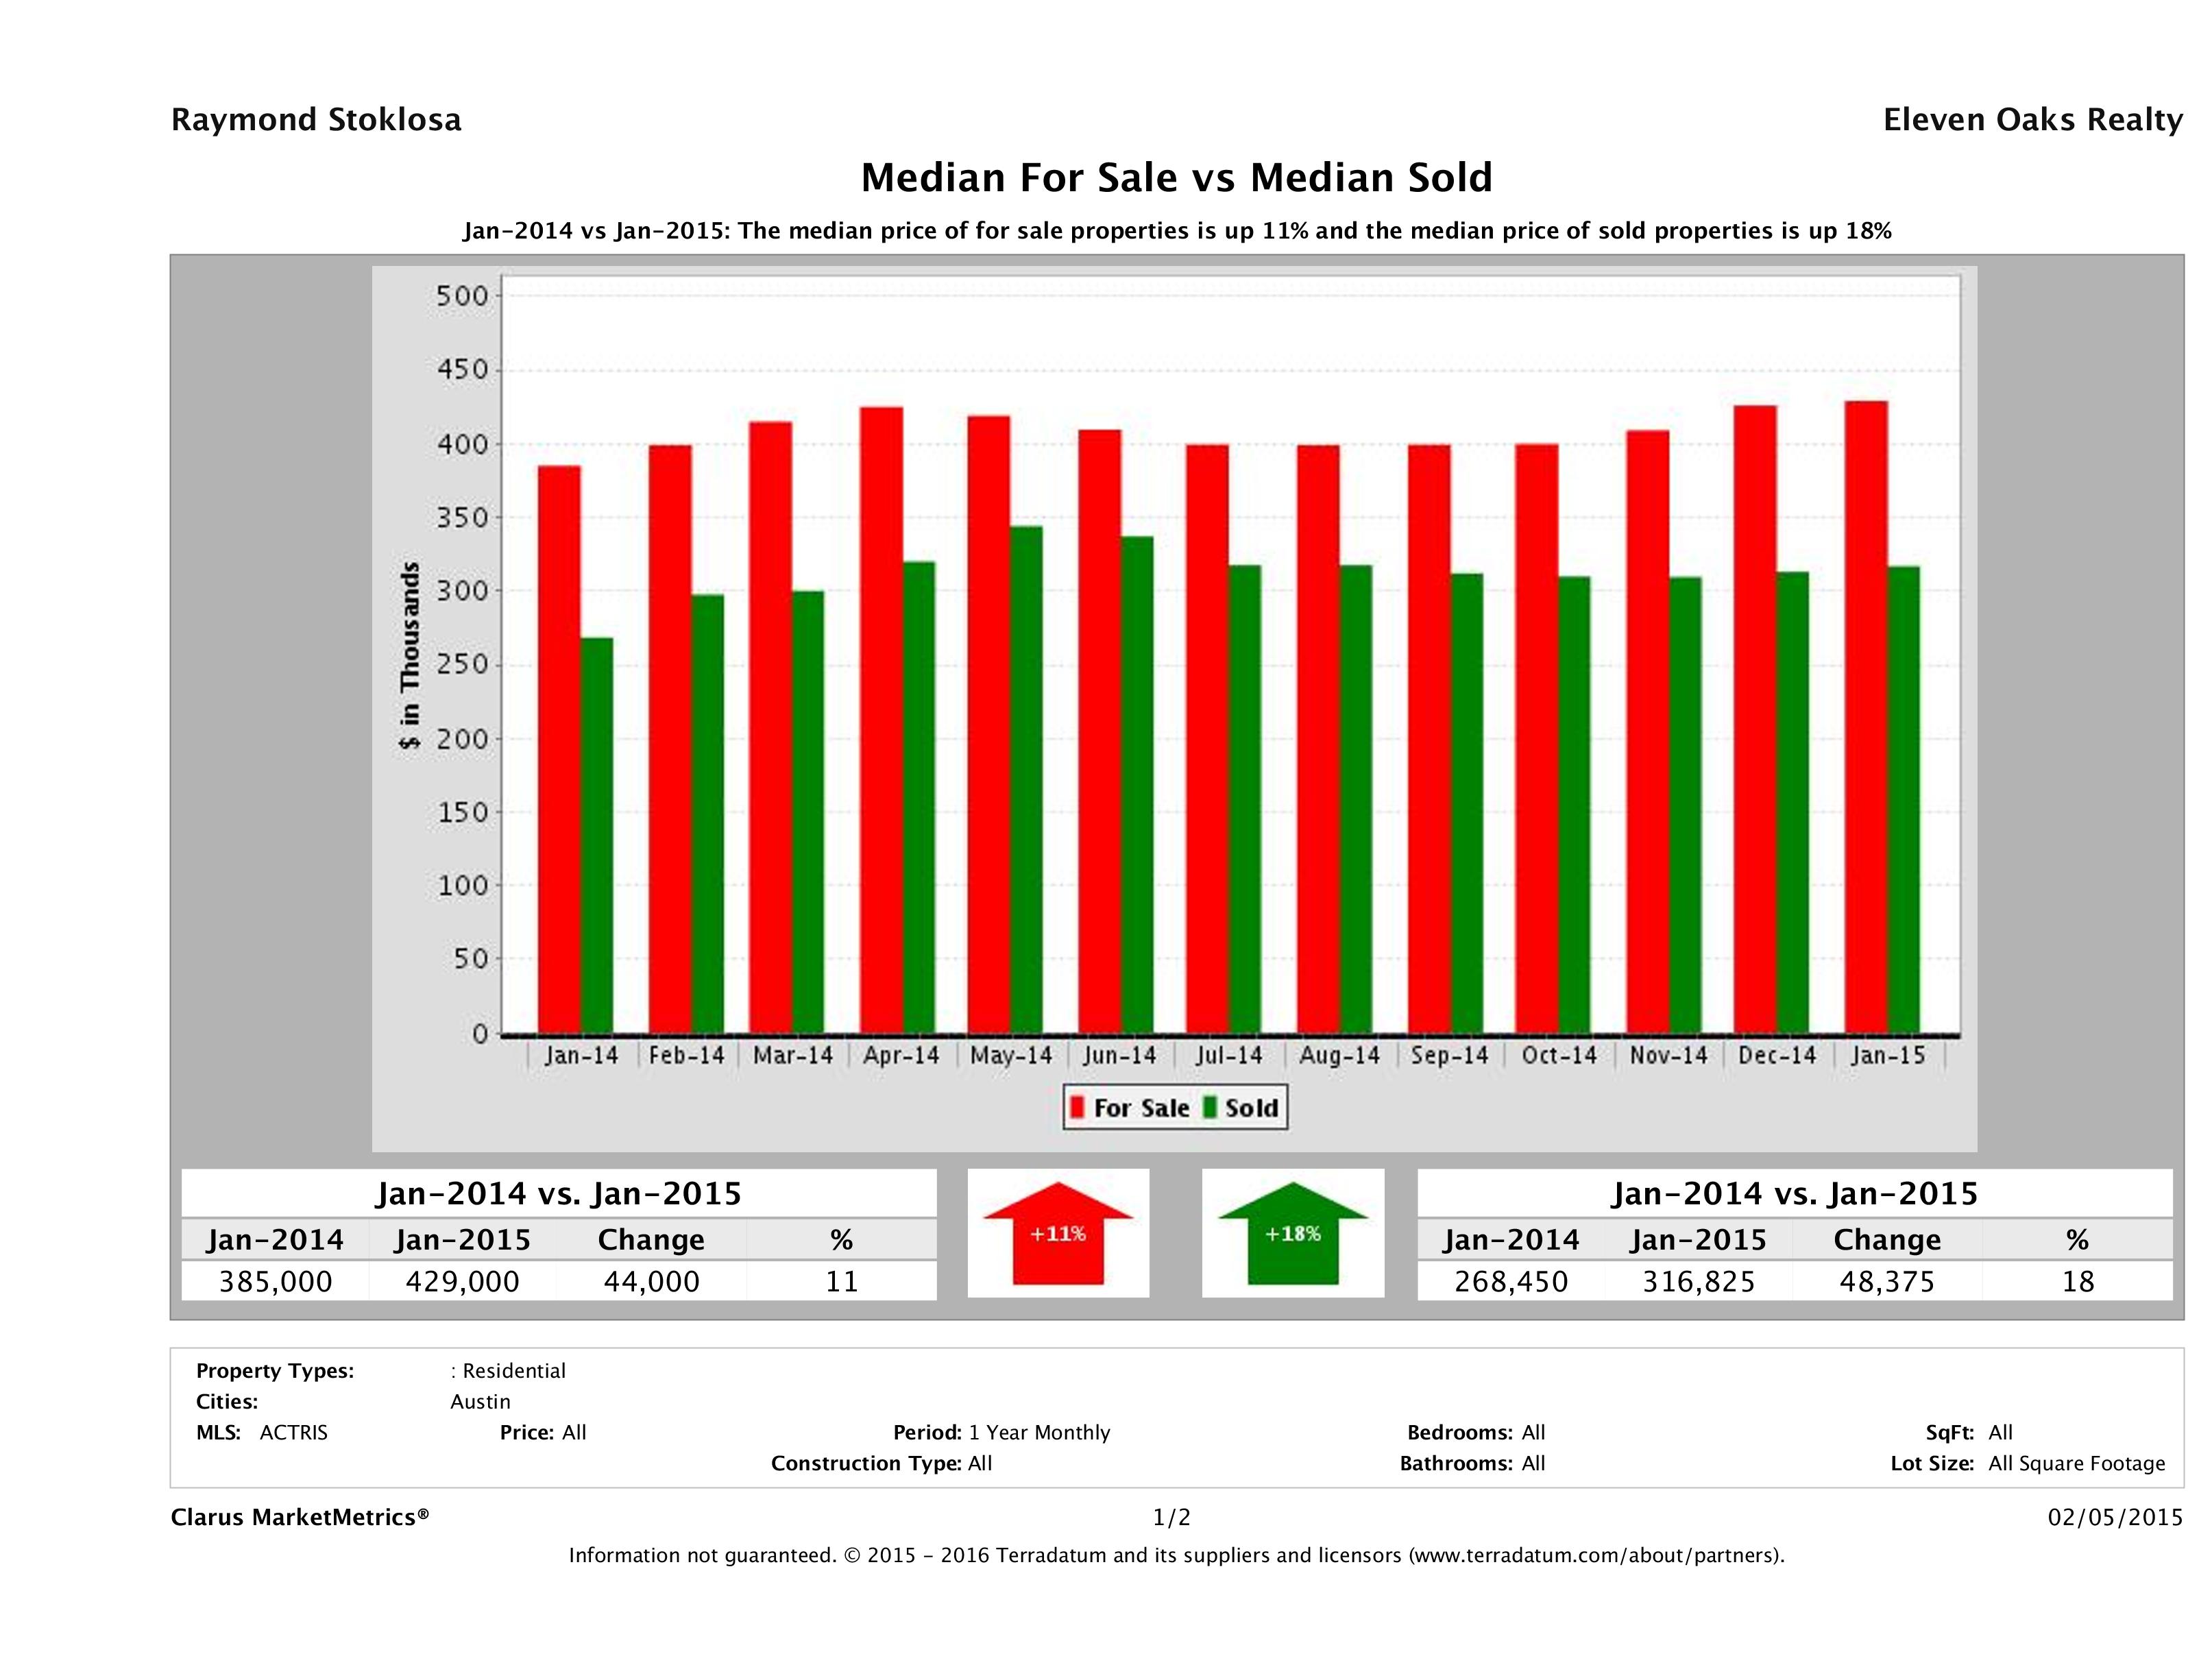
Source: Clarus Market Metrics, ACTRIS Sold Data
January 2015 Austin Real Estate Price Report – Strictly Numbers
For those of you who prefer to see the actual numbers, we’ve included the figures for January 2015 Austin home sales below. The most expensive home that sold in January 2015 sold for $2,850,000 and the least expensive home sold for $60,000. Homes ranged in size from 480 sqft – 11,387 sqft with an average size of 2,095 sqft. The average price per square foot for a home that sold in Austin in January 2015 was $185.66 with the lowest being $56.76/sqft and the highest being $858.64/sqft. It took, on average, 51 days to sell a home in Austin and sellers received, on average, 95.57% of their original list prices.
| Beds | Baths | SqFt | List Price | LP/SqFt | Sold Price | SP/SqFt | SP/LP | SP/OLP | ADOM | |
|---|---|---|---|---|---|---|---|---|---|---|
| Min | 1 | 1 | 480 | $59,000 | $56.67 | $60,000 | $56.76 | 75.08% | 64.00% | 0 |
| Max | 14 | 14 | 11,387 | $2,995,000 | $981.70 | $2,850,000 | $858.64 | 120.18% | 153.30% | 611 |
| Avg | 4 | 3 | 2,320 | $447,043 | $190.92 | $431,643 | $185.66 | 97.77% | 95.57% | 51 |
| Median | 3 | 3 | 2,095 | $329,000 | $158.51 | $318,000 | $155.79 | 98.19% | 96.95% | 35 |
| Search Criteria | |||
|---|---|---|---|
| Status | Sold | Sold Date | Jan 2015 |
| Property Type | Single Family Homes | Number Sold | 517 |
| Source: | ABoR Sales Data | Area | Austin |
Time to Buy? Sell?
As we always say, the best time to buy or sell a home is when you need to buy or sell. If you have a house to buy, buying when its a sellers market may hurt you on the buying end, but you’ll make it up on the selling end. If you’re trying to get into the market for the first time, the only way you’ll know that we’ve “hit bottom” is when its in the rear view mirror. Work with professionals who can help you analyze your financial and lifestyle to determine if now is the right time to buy or sell.
Looking strictly at the numbers, it appears the recommendation for this month is – it’s time to buy, but also time to get ready to sell. In most markets, these numbers would signify it is time to sell, but because our market has been so strong for 3 years, buyers have to take the opportunities when they can get them. With supply up 11% and demand down 7%, buyers will have more choices and be able to negotiate better deals. If you’re looking to buy, we can help you find the right house in the right neighborhood for you and your family. We know the market and know how to make the process as stress free as possible. For more info about buying a home, visit Buy a Home in Austin.
If you’re a seller who needs to sell, work with a professional Realtor who can help you position your home as the best value on the market. There are still highly motivated buyers in the market who are ready to make stronger offers than they were last year. With 2.0 months of inventory, we are still in a strong seller’s market, just not as strong as the Spring market. If you’re looking to trade up, take advantage of the market forces that make it easier for buyers. What you might not get on the selling end will usually be recovered on the buying end. Check out our 88 Ways to Sell Your Home Faster and For More Money for some tips on how you can prepare your home to meet the market. If you just want to test the market, wait until Spring. Historically, homes that sold in Spring sell for more than at any other time of the year. For more info about our Home Selling Program, check out Sell My Austin Home.
Questions About the Austin Real Estate Price Report?
Do you have questions about this Austin Real Estate Price Report? Call us at (512) 827-8323 or email us at info@11OaksRealty.com and we’ll help you in any way we can. If you’re looking to buy or sell Austin real estate, don’t forget to check out our Buyer Resources and our Seller Resources for more tips.
Leave a Reply